Table of Contents
Introduction
At CES, NVIDIA announced its next generation of consumer desktop graphics cards: the GeForce RTX™ 50 series, based on the Blackwell architecture. As we covered in our recent GeForce RTX™ 5090 review, these GPUs promise improved performance in gaming and content creation. This boost is the result of more and improved CUDA cores, fourth-generation Ray Tracing and fifth-generation Tensor Cores, the latest NVIDIA NVENC/NVDEC media engines, and higher power budgets. These hardware updates are packaged alongside a multitude of new technologies like DLSS 4, RTX Mega Geometry, and new NVIDIA Broadcast features.
In this article, we will examine how the new GeForce RTX 5090 and 5080 compare against previous-gen GPUs in various AI-based workloads, both open-source and closed.
Image
Below, we have listed the most relevant specifications from recent AMD, Intel, and NVIDIA GPUs. For more information, visit Intel Ark, NVIDIA’s 40-series GeForce page, NVIDIA’s 50-series GeForce page, or AMD’s Radeon RX Page.
| GPU | MSRP | VRAM | AI TOPS (INT8) | Boost Clock | VRAM Bandwidth | TDP | Release Date |
|---|---|---|---|---|---|---|---|
| NVIDIA GeForce RTX™ 5090 | $2,000 | 32 GB | 838 | 2.41 GHz | 1792 GB/sec | 575 W | Jan. 2025 |
| NVIDIA GeForce RTX™ 3090 Ti | $2,000 | 24 GB | 320 | 1.86 GHz | 1001 GB/sec | 450 W | Jan. 2022 |
| NVIDIA GeForce RTX™ 4090 | $1,600 | 24 GB | 660.6 | 2.52 GHz | 1001 GB/sec | 450 W | Oct. 2022 |
| NVIDIA GeForce RTX™ 4080 | $1,200 | 16 GB | 389.9 | 2.51 GHz | 736 GB/sec | 320 W | Nov. 2022 |
| NVIDIA GeForce RTX™ 3080 Ti | $1,200 | 12 GB | 272.8 | 1.67 GHz | 912 GB/sec | 350 W | June 2021 |
| AMD Radeon™ RX 7900 XTX | $1,000 | 24 GB | 122.8 | 2.5 GHz | 960 GB/sec | 355 W | Dec. 2022 |
| NVIDIA GeForce RTX™ 5080 | $1,000 | 16 GB | 450.2 | 2.62 GHz | 960 GB/sec | 360 W | Jan. 2025 |
| NVIDIA GeForce RTX™ 4080 SUPER | $1,000 | 16 GB | 418 | 2.55 GHz | 736 GB/sec | 320 W | Jan. 2024 |
| NVIDIA GeForce RTX™ 2080 Ti | $1,000 | 11 GB | 227.7 | 1.55 GHz | 616 GB/sec | 250 W | Sept. 2018 |
| NVIDIA GeForce RTX™ 4070 Ti SUPER | $800 | 16 GB | 353 | 2.61 GHz | 706 GB/sec | 285 W | Jan. 2024 |
| NVIDIA GeForce RTX™ 5070 Ti | $750 | 16 GB | 351.5 | 2.45 GHz | 896 GB/sec | 300 W | Feb. 2025 |
| NVIDIA GeForce RTX™ 4070 SUPER | $600 | 12 GB | 284 | 2.48 GHz | 504 GB/sec | 220 W | Jan. 2024 |
| NVIDIA GeForce RTX™ 5070 | $550 | 12 GB | 246.9 | 2.51 GHz | 672 GB/sec | 250 W | TBD |
| Intel Arc™ B580 | $250 | 12 GB | 233 | 2.67 GHz | 456 GB/sec | 190 W | Dec. 2024 |
Compared to the RTX 4090 with 512 4th generation Tensor Cores, the RTX 5090 features 680 5th generation Tensor Cores, an increase of 33%. This translates to an increase in FP/BF16 performance of about 27%, from 165.2 TFLOPS to 209.5 TFLOPS. This is somewhat disappointing for a new generation Tensor Core, but the real architectural change comes via support for FP4 precision (more on that later) rather than performance improvements to previously supported precisions. However, the most eye-catching improvement is the RTX 5090’s new memory configuration. Not only has the RTX 5090 received an extra 8 GB of VRAM for a total of 32 GB, but it also features an incredible 1.79 TB/s memory bandwidth contrasted with the RTX 4090’s 1.01 TB/s, made possible by the switch from GDDR6X to GDDR7. This is an exciting development for AI workloads, which are often constrained by memory bandwidth.
In contrast to the RTX 5090, the RTX 5080 presents a much more modest improvement over equivalent cards of the previous generation. It has a total of 336 Tensor Cores compared to the RTX 4080’s 304, an increase of about 10.5%. This translates to an FP/BF16 performance of 112.6 TFLOPS vs the RTX 4080’s 97.5 TFLOPS. Although the RTX 5080 also features GDDR7 memory, the total capacity remains unchanged at 16 GB, along with the memory bus-width of 256-bit. This does lead to a respectable 34% increase in memory bandwidth from the RTX 4080 to the RTX 5080 (716.8 GB/s vs 960 GB/s). Still, it’s hard not to be disappointed when considering that the improvement in memory bandwidth from the RTX 4090 to the RTX 5090 is a whopping 77%.
What is FP4?
Regarding AI/ML workloads, Blackwell’s big news is the inclusion of support for 4-bit precision floating point calculations, AKA FP4. Broadly speaking, lower precision calculations can be performed more quickly with less hardware real estate than those of higher precisions. This means that to optimize for performance, it’s best to use the lowest precision available that does not meaningfully affect the result of a calculation.
Particularly in the large language model (LLM) space, evidence shows that quantizing models, i.e. reducing their precision, can provide immense savings in computational and memory requirements without drastically impacting their accuracy. Assuming that one can overcome the technical challenges presented, pre-training models using lower precision also have benefits, as evidenced by recent releases like DeepSeek-V3 and R1.
Therefore, it seems natural for hardware manufacturers like NVIDIA to look ahead and provide hardware with dedicated support for lower precisions, like FP4. However, the reality is that software support is basically nonexistent, so for end-users with existing workflows, there’s currently not much benefit to having hardware that can perform FP4 calculations. Although there are teams like Black Forest Labs who have worked with NVIDIA to provide an FP4 version of their FLUX.1 image generation model, actually using the model is not as simple as dropping it into your favorite image generation application.
So for now, the benefits of native FP4 support are primarily theoretical – but as the ecosystem continues to mature and develop, we fully expect to see more utilization of this capability.
Test Setup
Test Platform
| CPUs: AMD Ryzen™ 9 9950X |
| CPU Cooler: Noctua NH-U12A |
| Motherboard: ASUS ProArt X670E-Creator WiFi BIOS Version: 2604 |
| RAM: 2x DDR5-5600 32GB (64 GB total) |
| PSU: Super Flower LEADEX Platinum 1600W |
| Storage: Samsung 980 Pro 2TB |
| OS: Windows 11 Pro 64-bit (26100) Power Profile: Balanced |
GPUs
| NVIDIA GeForce RTX™ 5090 Driver: 571.86 NVIDIA GeForce RTX™ 5080 Driver 572.12 |
| NVIDIA GeForce RTX™ 4090 NVIDIA GeForce RTX 4080™ SUPER NVIDIA GeForce RTX 4080 NVIDIA GeForce RTX™ 3090 Ti NVIDIA GeForce RTX™ 3080 Ti NVIDIA GeForce RTX™ 3080 NVIDIA GeForce RTX™ 2080 Ti Driver: 566.36 |
| AMD Radeon™ RX 7900 XTX Driver: Adrenaline 24.12.1 |
Benchmark Software
| llama.cpp (b4493) – Phi-3 Mini Q4_K_M |
| MLPerf Client v.0.5.0 – Llama 2 7B Chat DML |
| SD.Next (2025-01-29) – SDXL Base 1.0 |
| DaVinci Resolve 19.1 – PugetBench for DaVinci Resolve 1.1.0 |
| Topaz Video AI 6.0.3.0 |
For our GPU testing, we have shifted to an AMD Ryzen 9 9950X-based platform from our traditional Threadripper platform. The 9950X has fantastic all-around performance in most of our workflows and should let the video cards be the primary limiting factor where there is the possibility of a GPU bottleneck. This means the results are more comparable to our recent Intel Arc B580 review, but less so to our past GPU reviews. However, we are doing our best to test a variety of past GPUs throughout our RTX 50-series reviews, so we should have a lot of updated results in the near future. For testing, we used the latest available GPU drivers and tested everything on the “balanced” Windows power profile. Resizeable BAR and “Above 4G Decoding” were enabled for every GPU as well.
For our first hardware review focused on AI workloads, we chose a suite of five tests comprised of a mix of both open-source and commercial software. The former tests consist of llama.cpp and MLPerf Client, both of which test how the GPUs handle LLM workloads, along with SD.Next for testing image generation. On the commercial software side, we used our PugetBench for DaVinci Resolve benchmark, focusing on Resolve Studio’s AI-based features found in the “Extended” version of the test and the benchmark included within Topaz Video AI. More details about each test can be found in their respective sections below.
Looking for AI and HPC Workstations?
We build computers tailor-made for your workflow.
Don’t know where to start?
We can help!
Get in touch with our technical consultants today.
LLM: llama.cpp


System Image
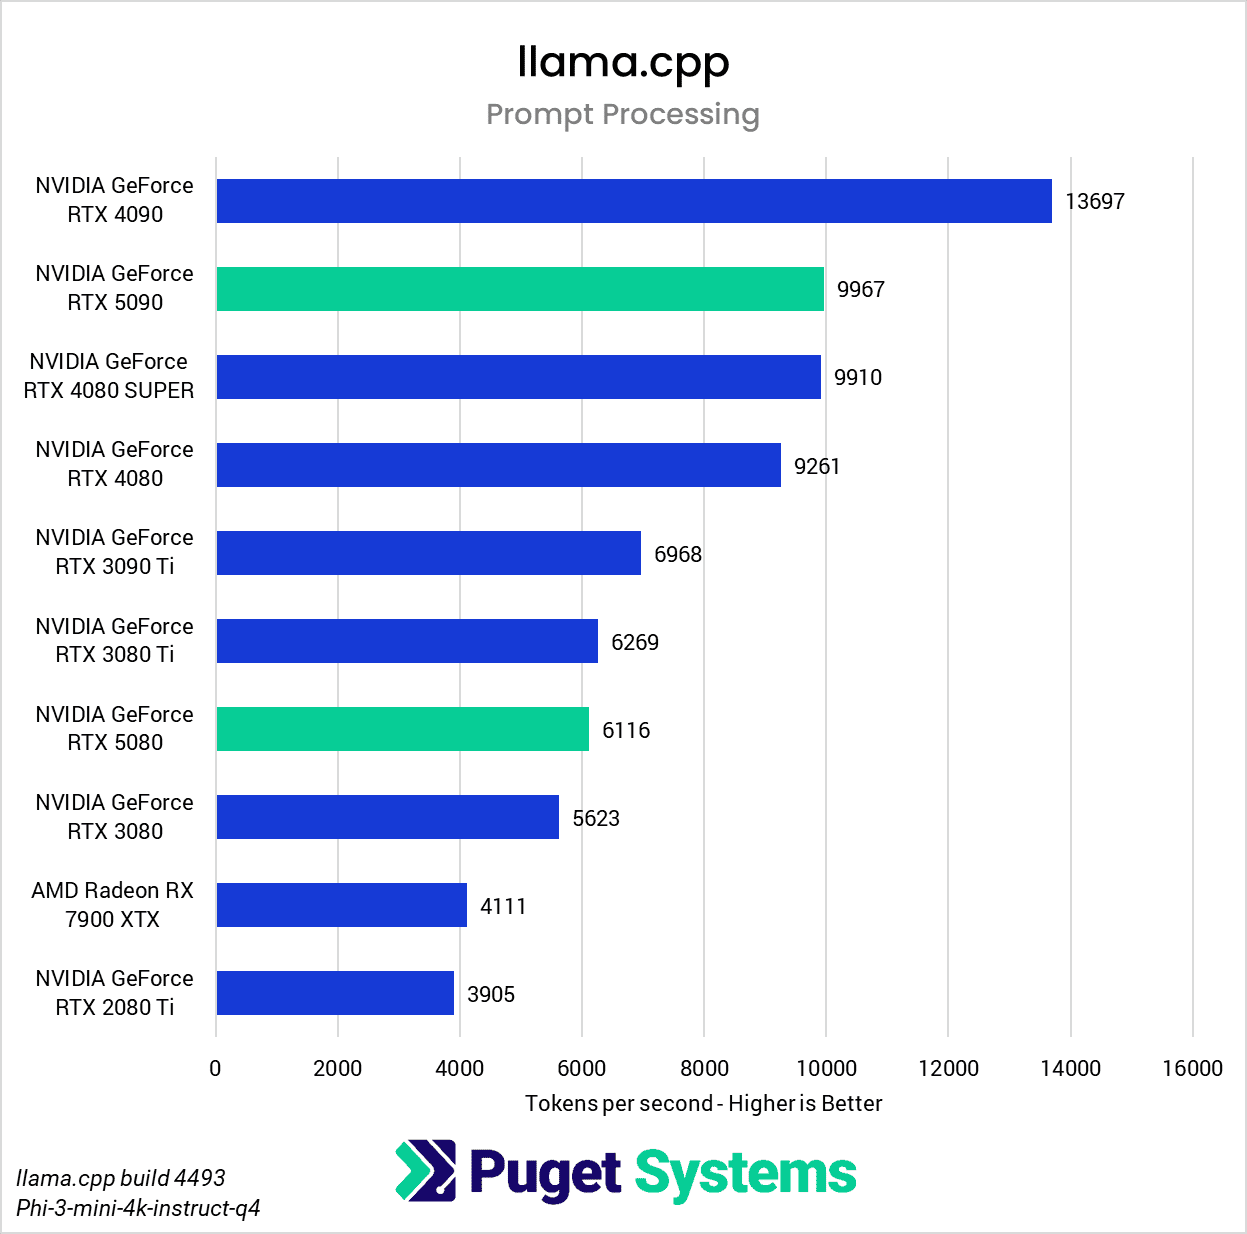
Starting with the ubiquitous llama.cpp, we immediately see some unexpected results from both the RTX 5090 and the RTX 5080. During the prompt processing test (Chart 1), both GPUs scored considerably lower than expected. Considering that prompt processing speed correlates closely with compute performance, we should expect to see the RTX 5090 score noticeably higher than the RTX 4090, but it falls short of that expectation, achieving performance similar to the RTX 4080 SUPER. Likewise, the RTX 5080 should come out just ahead of the RTX 4080 SUPER, but it instead achieves performance similar to that of the RTX 3080 Ti.
It’s clear that these results are not actually indicative of the relative performance of the 50-series cards, and we suspect that a driver issue may be the cause, as performance testing using llama.cpp in Linux does not show these same discrepancies.
Moving on to the token generation test (Chart 2), we thankfully did not encounter any anomalous results with the new GPUs. As shown previously, token generation performance is more dependent on a GPU’s memory bandwidth, and with an astounding 1.79 TB/s, the RTX 5090 handily takes the top spot on the token generation chart. The RTX 5090 leads the previous flagship, the RTX 4090, by a healthy margin of about 29%. The RTX 5080 also scores very well, landing just short of the RTX 4090’s performance.
LLM: MLPerf Client


Next up is MLPerf Client, a new addition to our AI benchmarks. Although it’s still in early development with some kinks to work out, MLPerf Client already has good flexibility in testing LLM workloads, and its use of ONNX Runtime for DirectML means that it offers broad support for different GPU manufacturers in a single package. Despite the fact that it runs a few different styles of tests featuring a mix of prompt sizes and response token limits, we opted to show only the overall results because the shape of the scores is functionally identical across each workload.
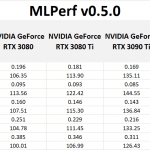
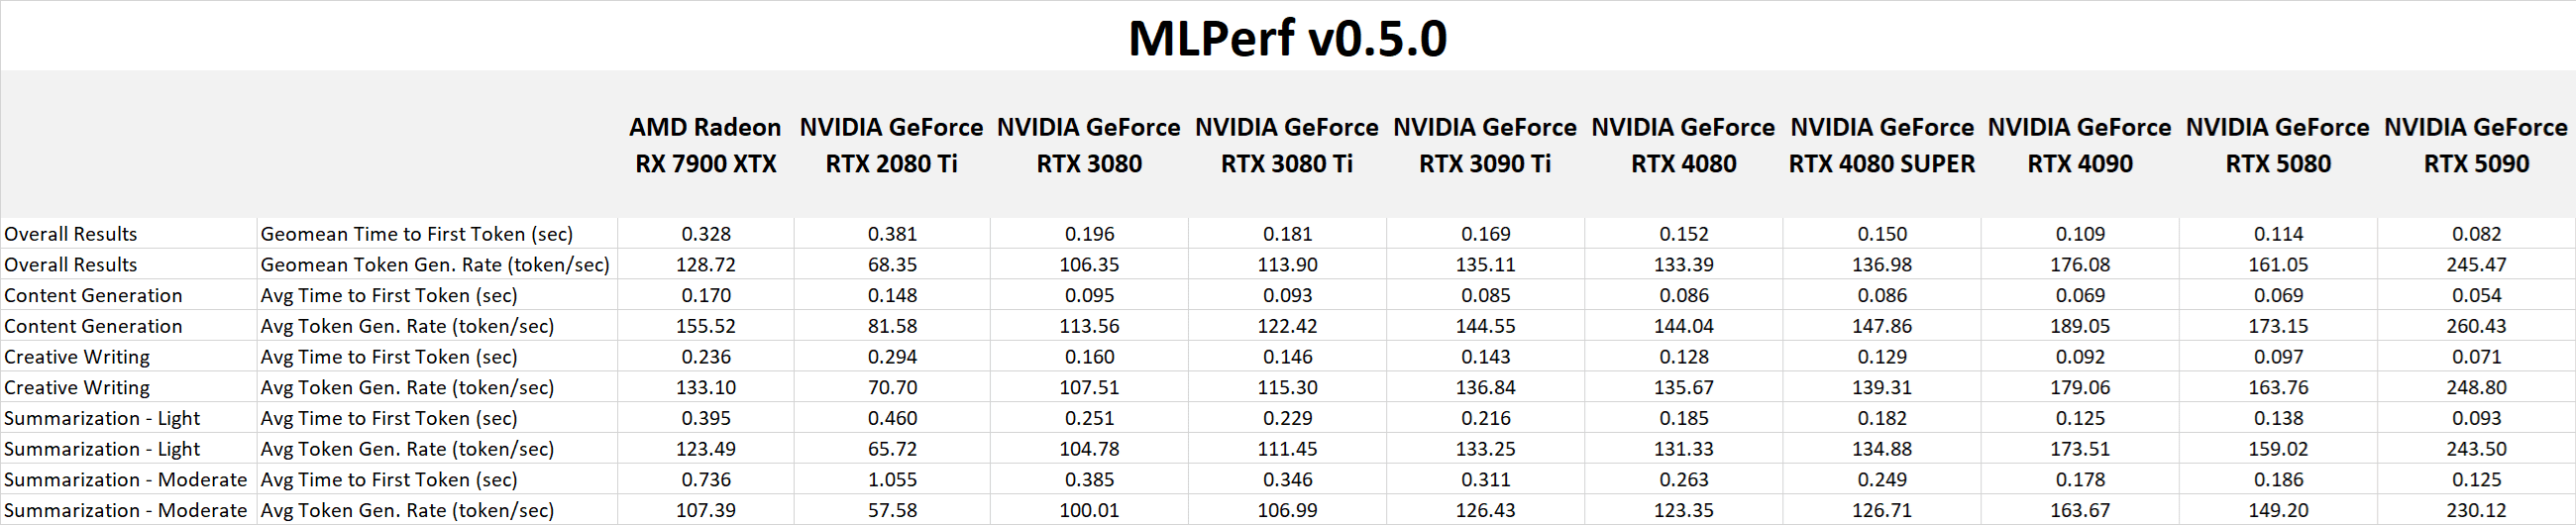
This is the first time we’ve recorded and presented Time To First Token (TTFT) in our benchmarks (Chart 1). TTFT represents an important metric regarding the end-user experience of interacting with an LLM because it measures how long a user has to wait after their query to begin receiving a response. However, with small models hosted locally within a single GPU, the delay is so minuscule it’s worth asking how valuable the metric is at this scale. In any case, the RTX 5090 was the only GPU that achieved a sub-100ms result, with the RTX 4090 lagging behind by about 33%. Surprisingly, the RTX 5080 also managed to come out ahead of the RTX 4080 and 4080 SUPER by about the same margin of 33%. This seems to indicate a preference for higher memory bandwidths in this test, but the lackluster results of the 3080 Ti and 3090 Ti also point towards compute being a limiting factor as well. This makes sense, considering that prompt processing is known to be compute-bound while token generation is memory bandwidth-bound – and to measure TTFT, both stages are required. So, although most would be hard-pressed to notice differences measured in tens of millliseconds, TTFT does prove itself to be an excellent measure of overall GPU performance for LLM usage.
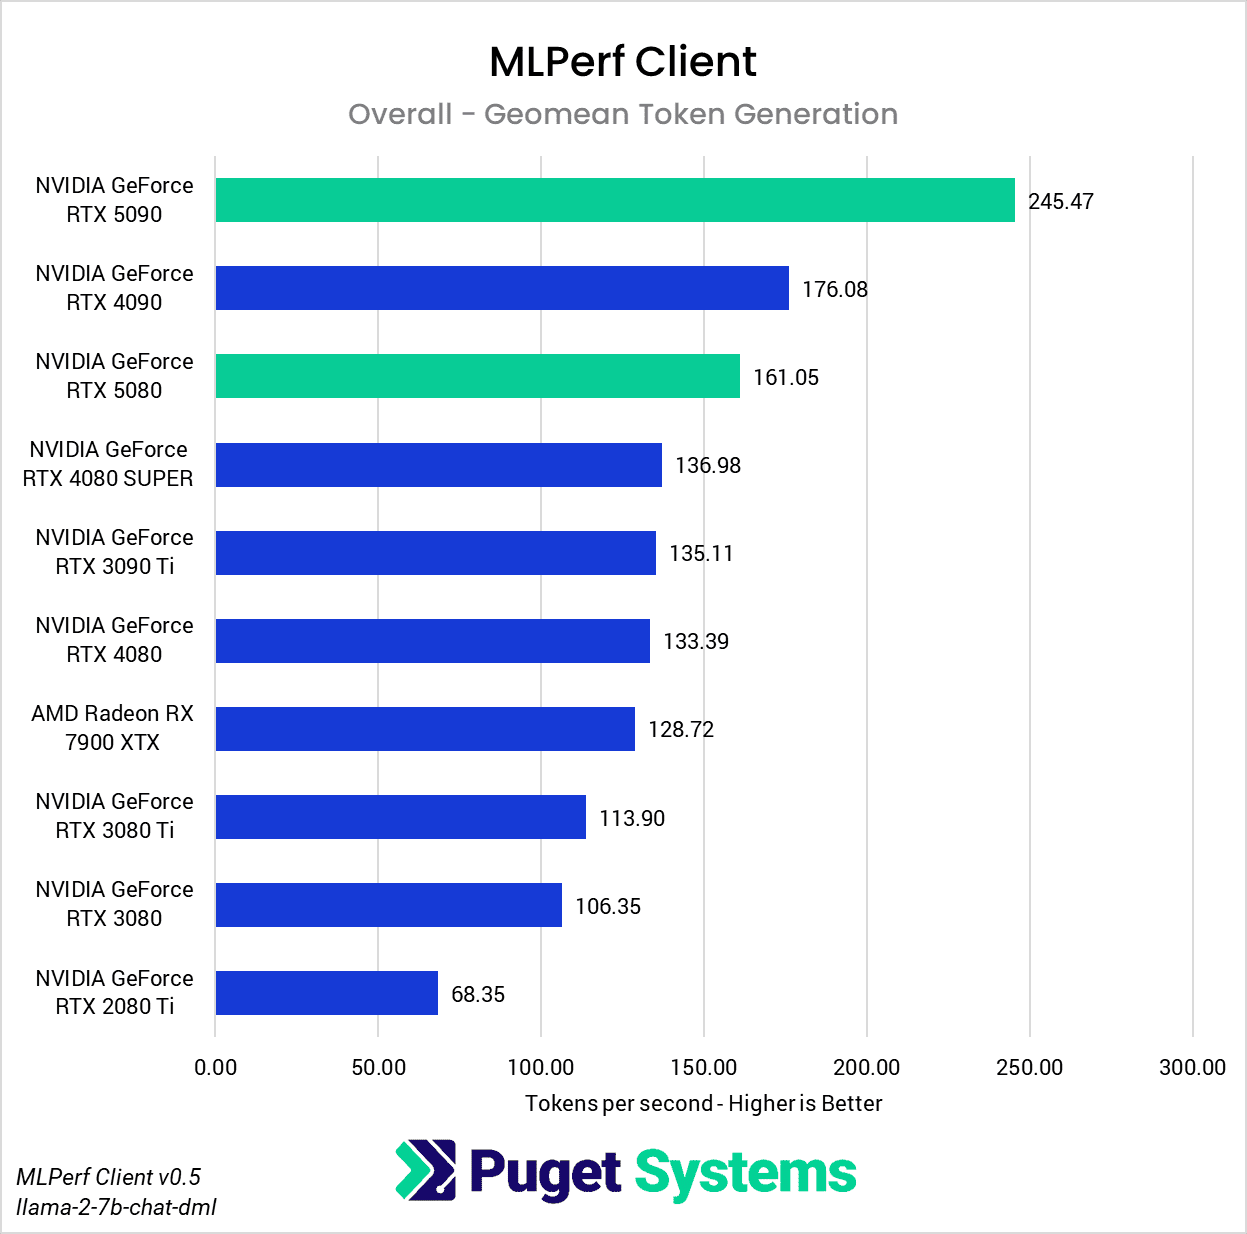
Just like we saw with llama.cpp, the RTX 5090’s memory bandwidth allows it to shine during token generation (Chart 2), far outpacing any other GPU in this round of testing. As expected, with memory bandwidth similar to the RTX 4090, the RTX 5080 approaches the 4090’s performance in this test and outpaces the RTX 4080 and 4080 SUPER by around 20%.
Image Generation: SD.Next

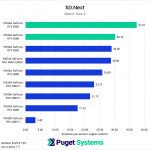


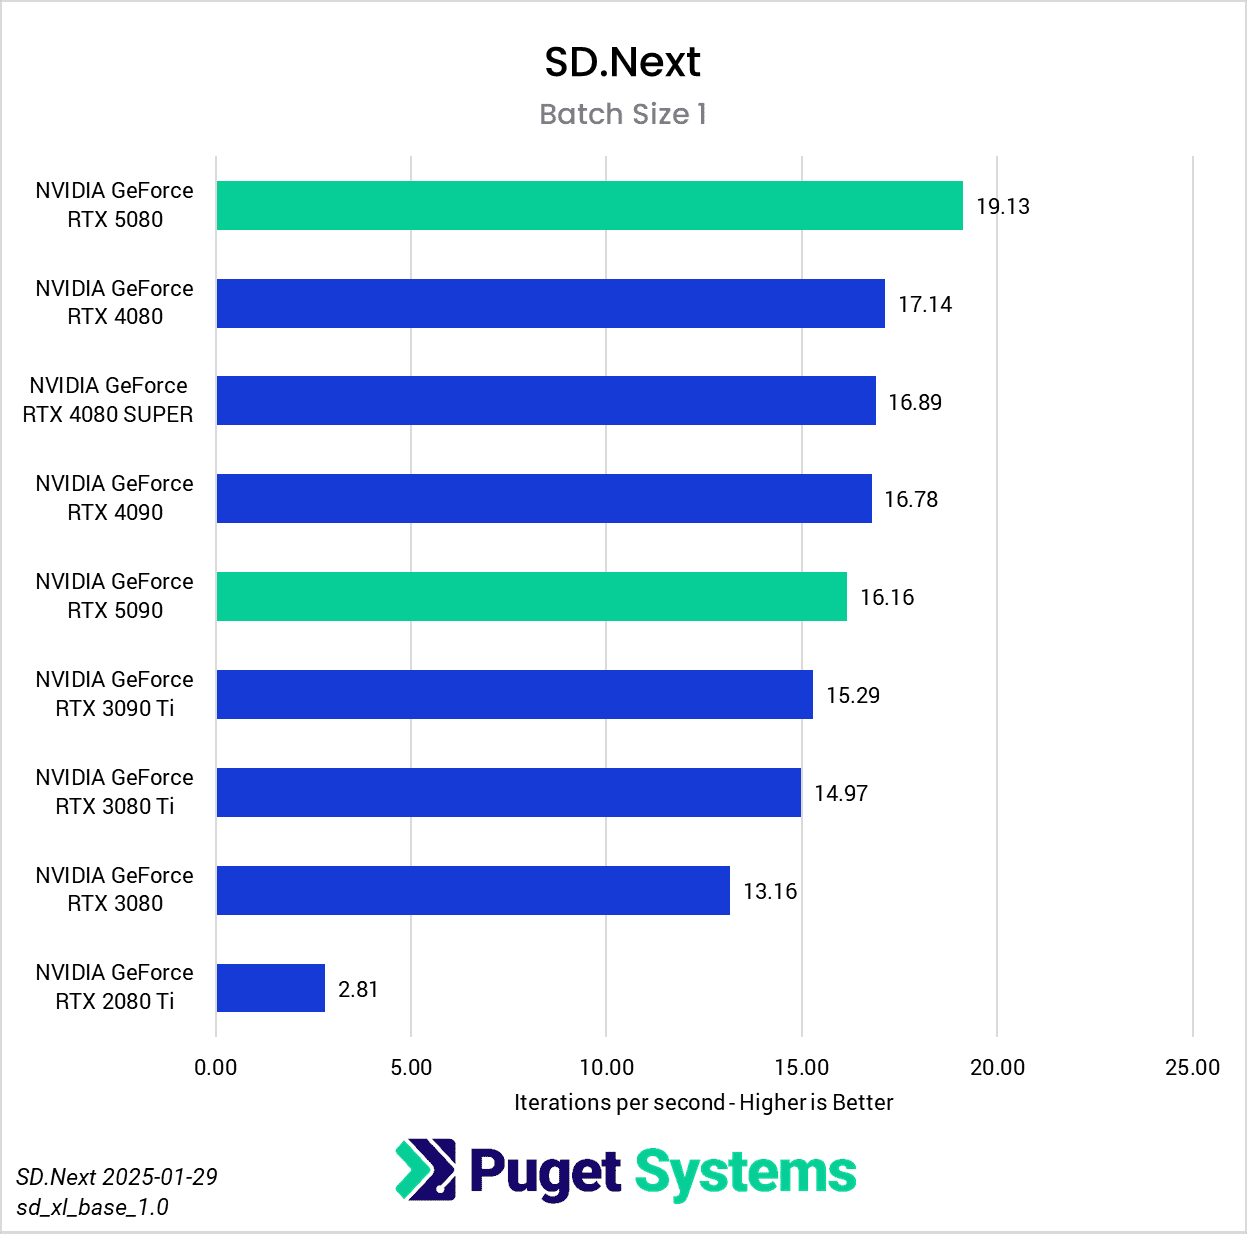
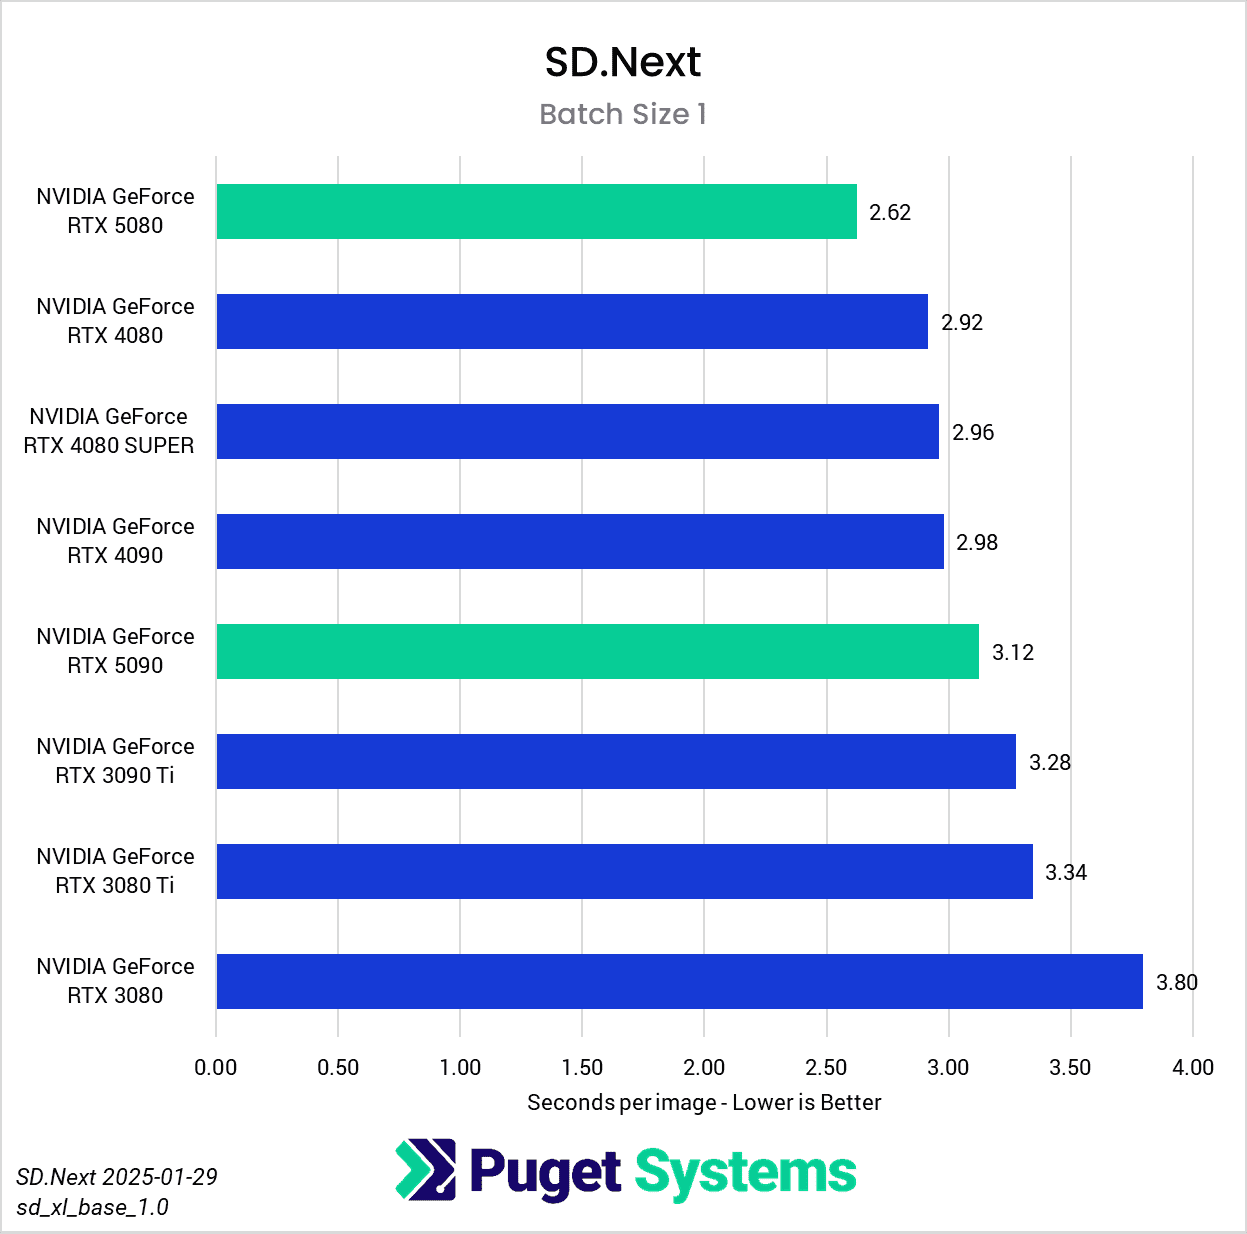
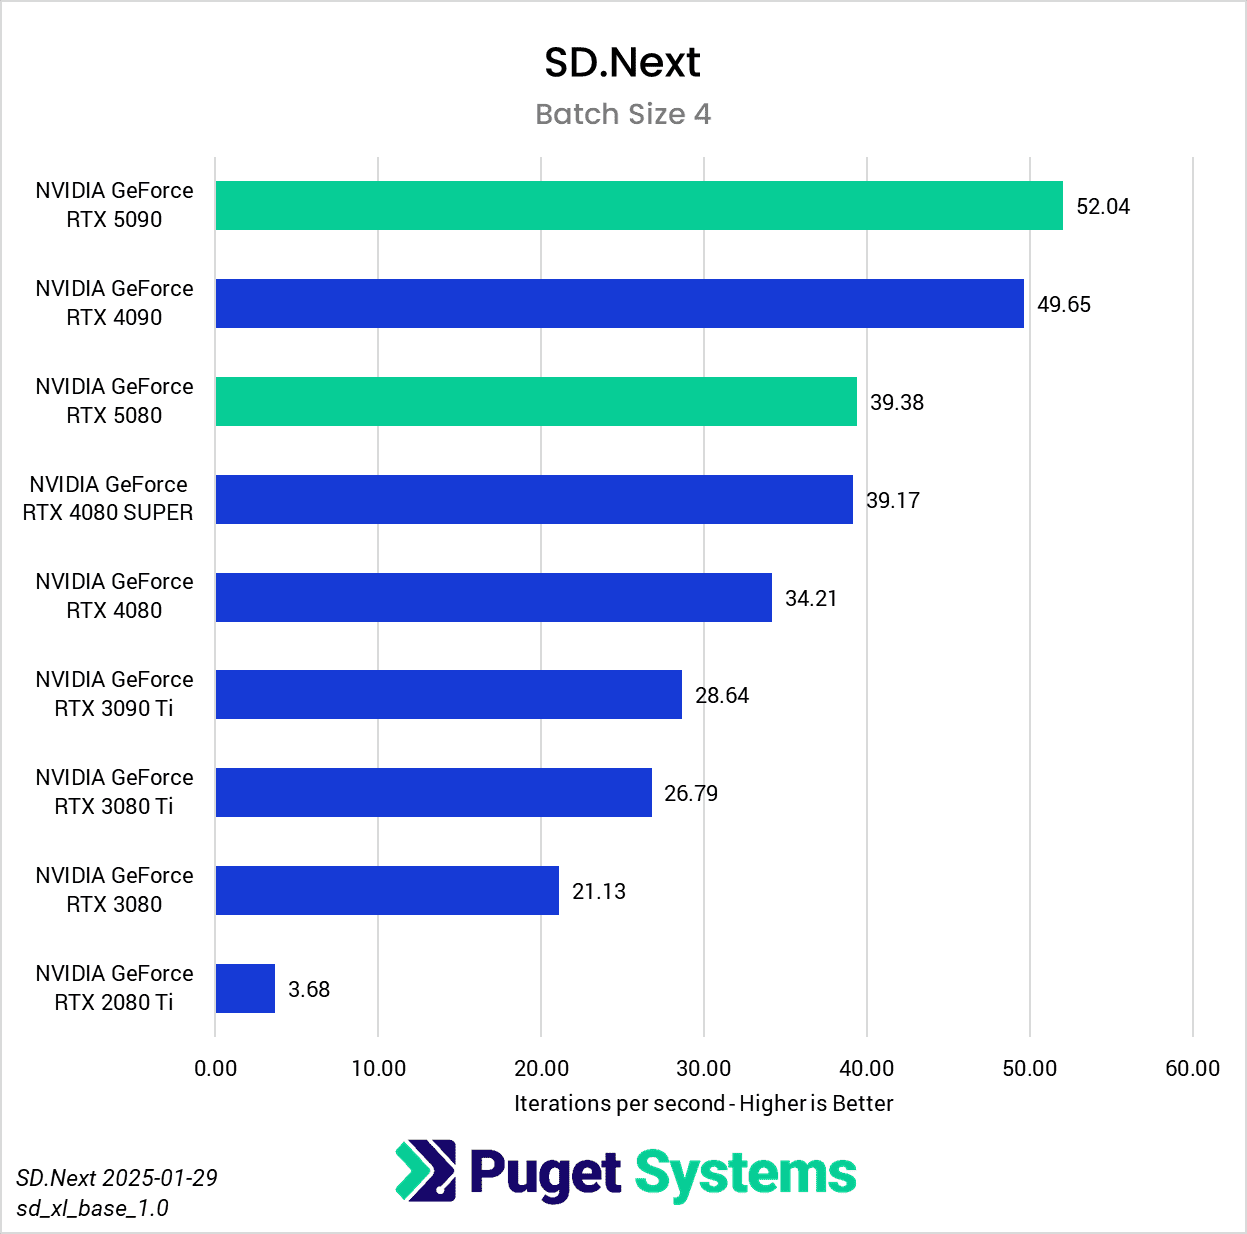
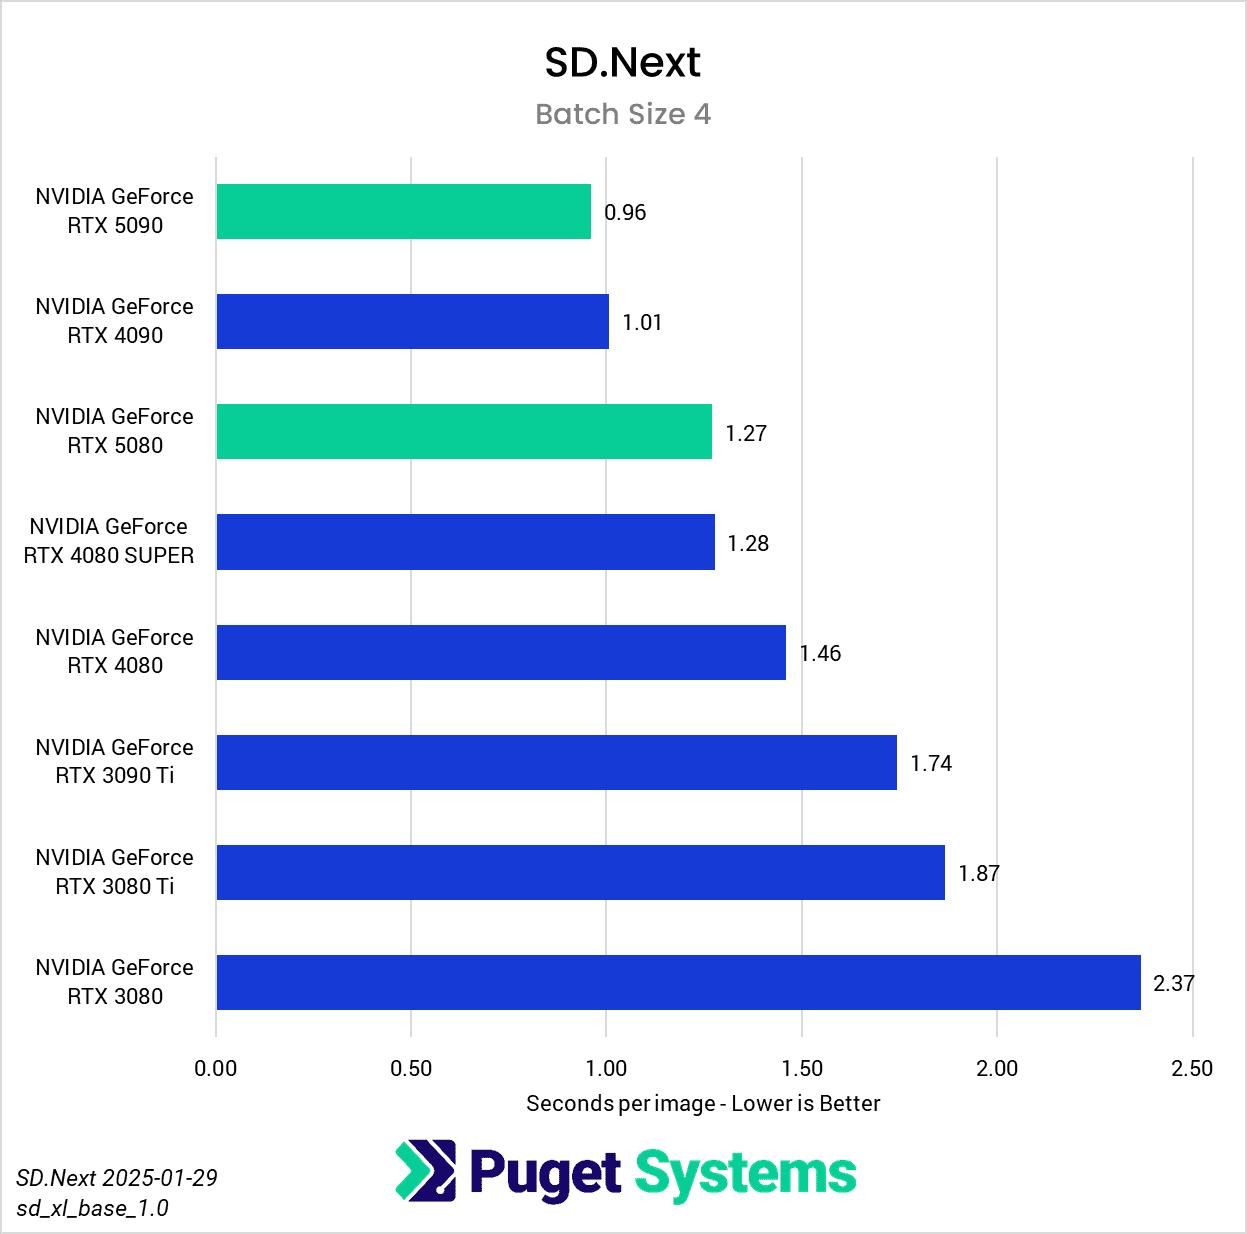
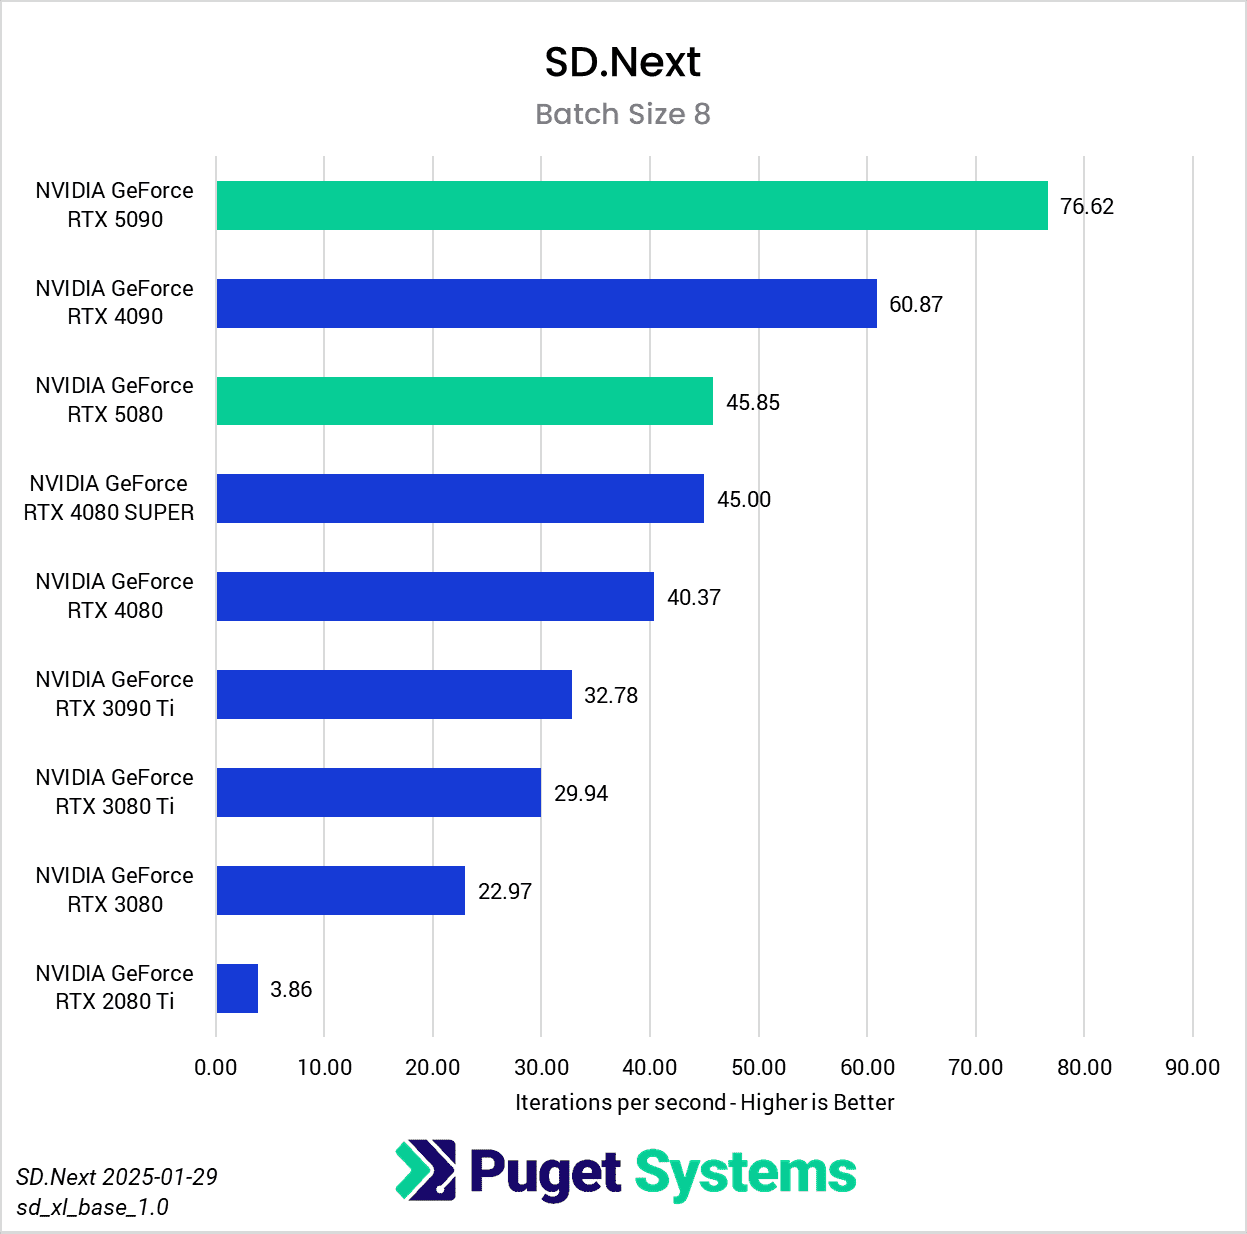
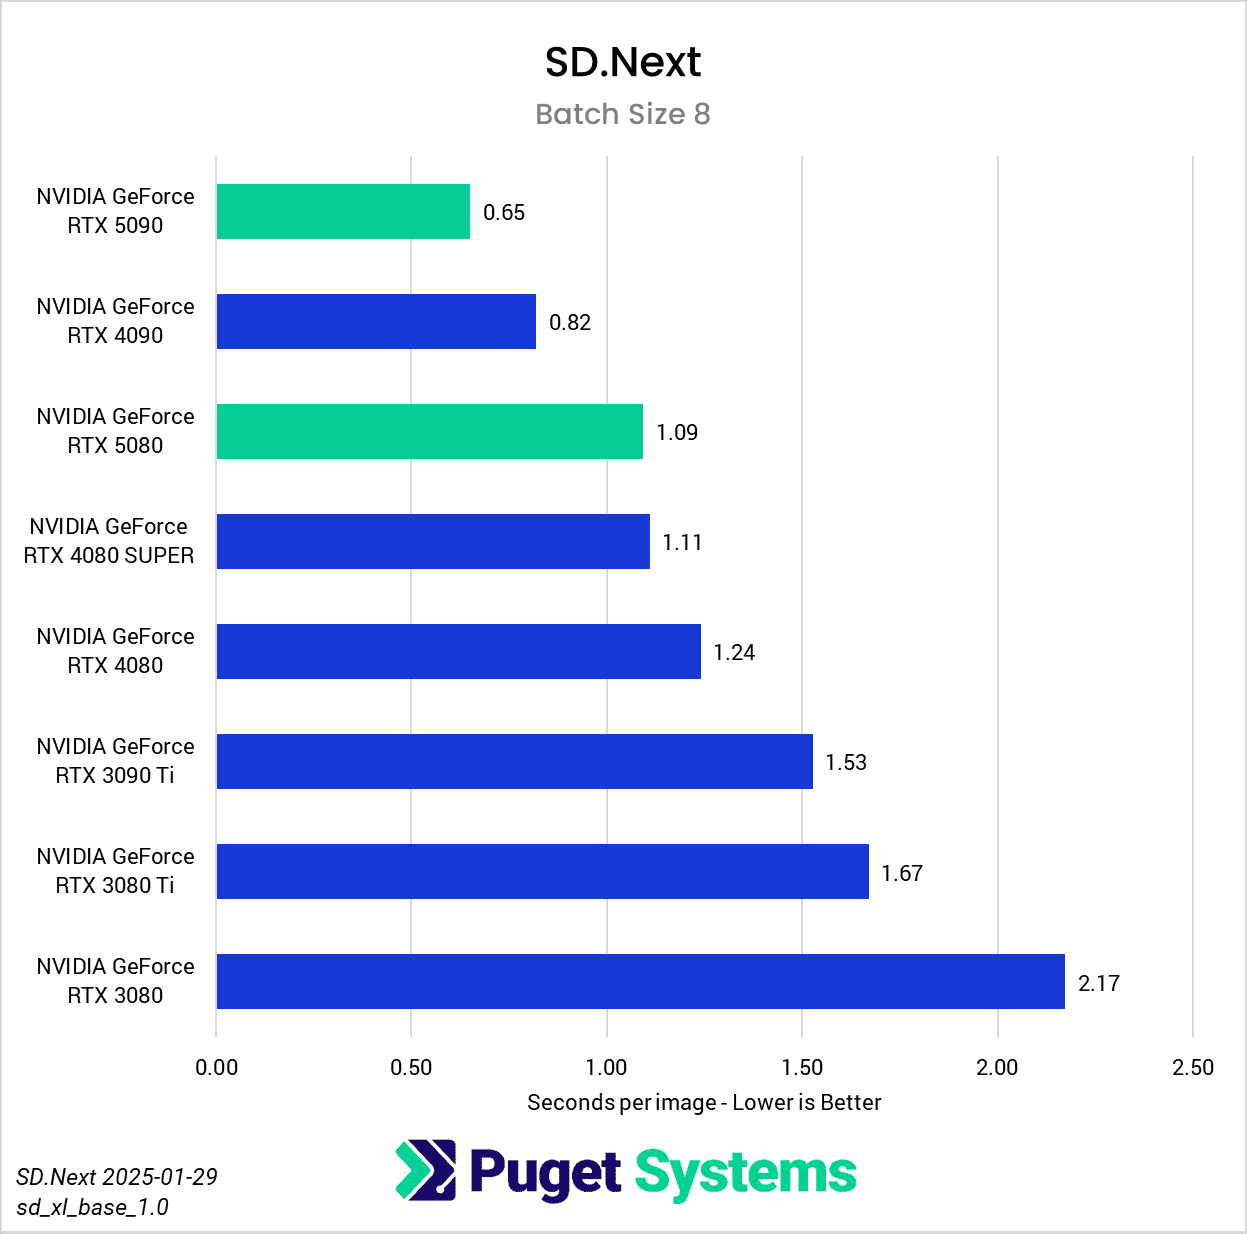


Switching gears from text to image generation, we have the SD.Next benchmark. We’ve chosen to stick with SDXL for our model, SDPA as the cross-attention method, 50 steps per batch, and a resolution of 512×512. The relatively low resolution may strike some as an odd choice, but as it’s the default resolution for SD.Next’s benchmark, we thought it would make it simpler for others to replicate our results. Something to note on these charts is that we opted to omit the 2080 Ti’s results from the “seconds per image” charts to help with chart scaling, as it took considerably longer for it to complete the tests compared to the other GPUs tested. Finally, it’s worth keeping in mind that we used early-access PyTorch wheels (torch-2.6.0+cu128.nv) to enable support for the 50-series GPUs, and it’s likely that these are not fully optimized quite yet. We are eagerly awaiting the full release of PyTorch supporting CUDA 12.8, and plan to publish updated results when that becomes available.
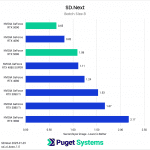
Right off the bat, we encountered some strange results at the minimum batch size of 1 (Charts 1 & 2). We unexpectedly found the RTX 5080 taking the top spot among all of the GPUs tested, somehow beating out both the RTX 5090 and 4090. We also see both RTX 4080 variants come out slightly ahead of the RTX 5090 and 4090. The most likely explanation for this is a CPU bottleneck somewhere in the generation pipeline, which most prominently affects these shorter runs at smaller batch sizes. Indeed, Task Manager shows 100% usage on a single CPU thread at the start of the generation. Once the batch size is increased sufficiently, the workload stays on the GPU long enough that the time spent waiting on the CPU thread becomes less impactful.
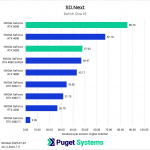
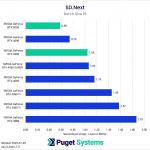
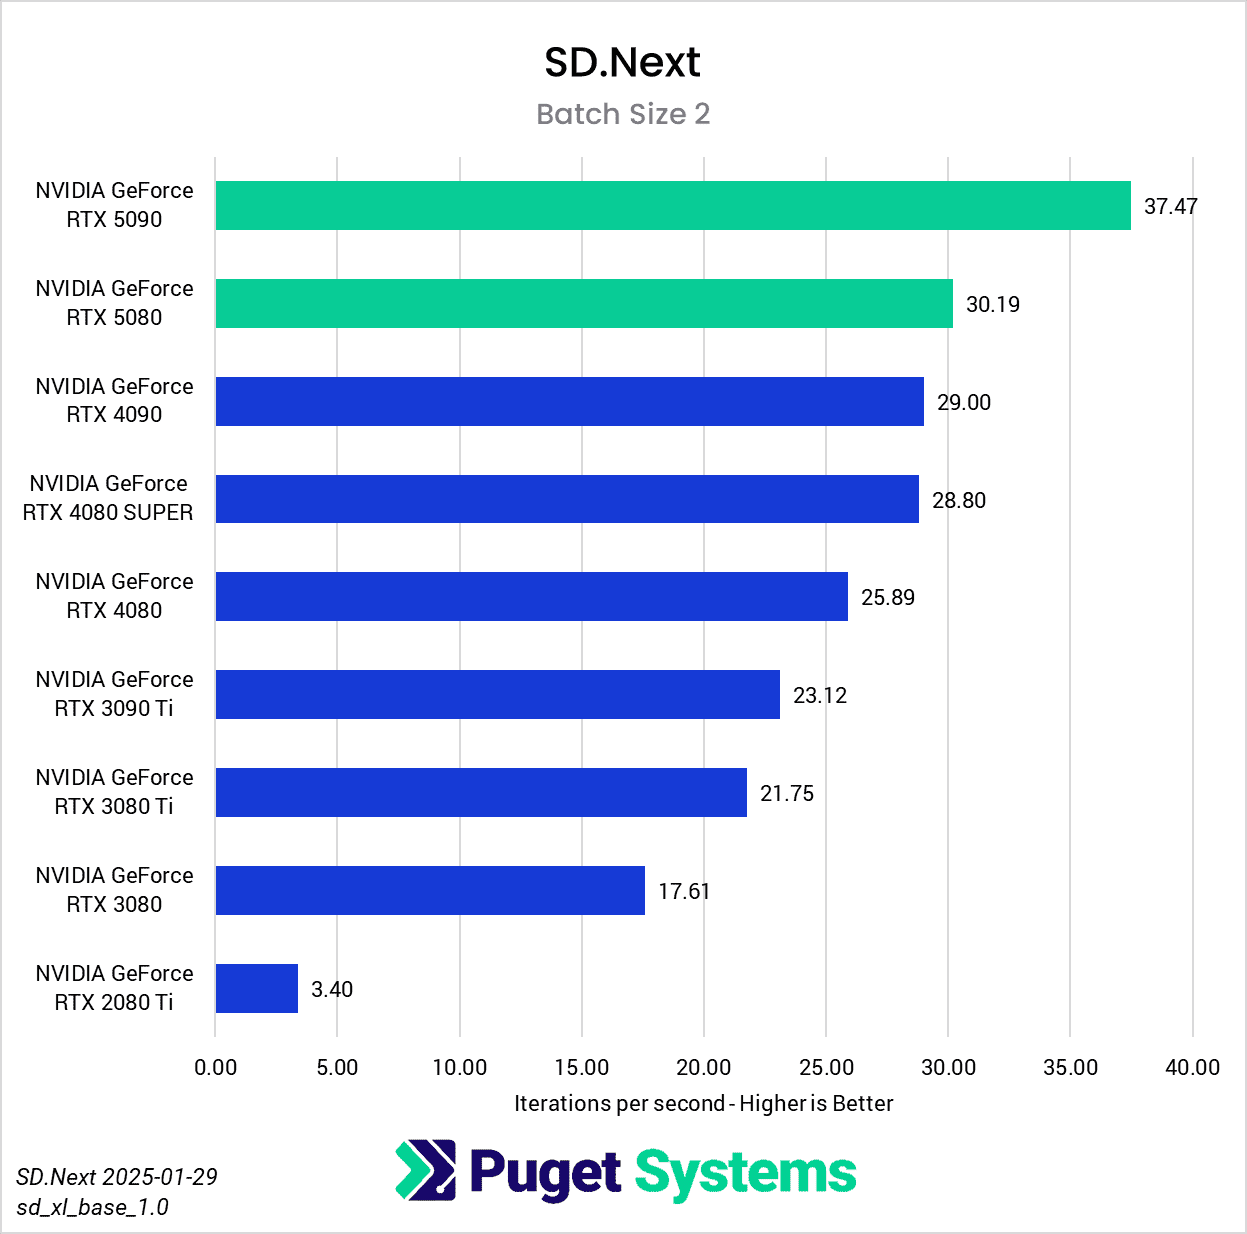
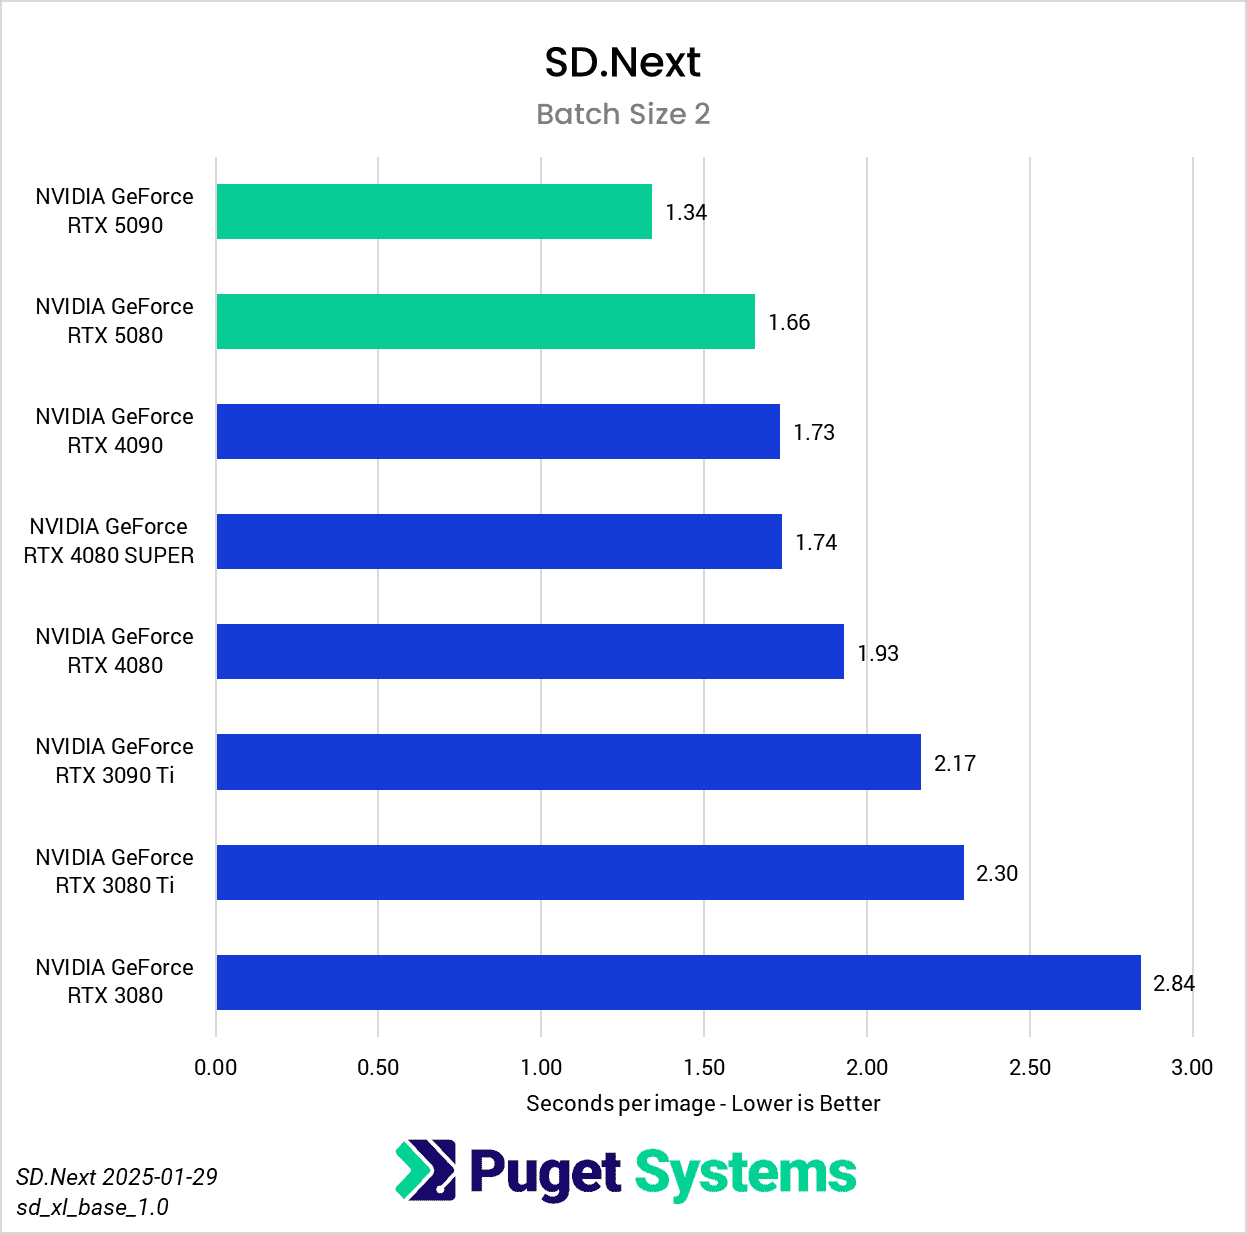
In any case, once we progress to batch sizes higher than 1, we see things start to take a more familiar shape. At a batch size of 2 (Charts 3 & 4), we still encountered some odd results – such as the 4080 SUPER, 4090, and 5080 all achieving very similar scores. However, at batch sizes 4 and above the results become more aligned with the expected performance. With a batch size 4 (Charts 5 & 6), the RTX 5090 and RTX 4090 have nearly identical performance, but as the batch sizes continue to increase, the RTX 5090 pulls further ahead – translating to roughly .15 seconds less per image generated. In contrast, we see the RTX 5080 and RTX 4080 SUPER achieve practically identical scores at all batch sizes above 1.
Video: DaVinci Resolve Studio AI Features
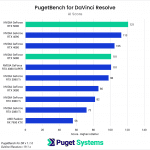

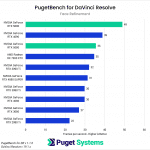
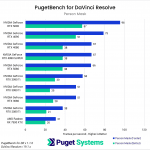

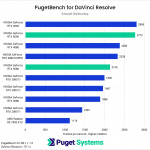
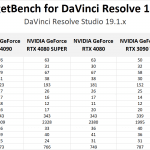
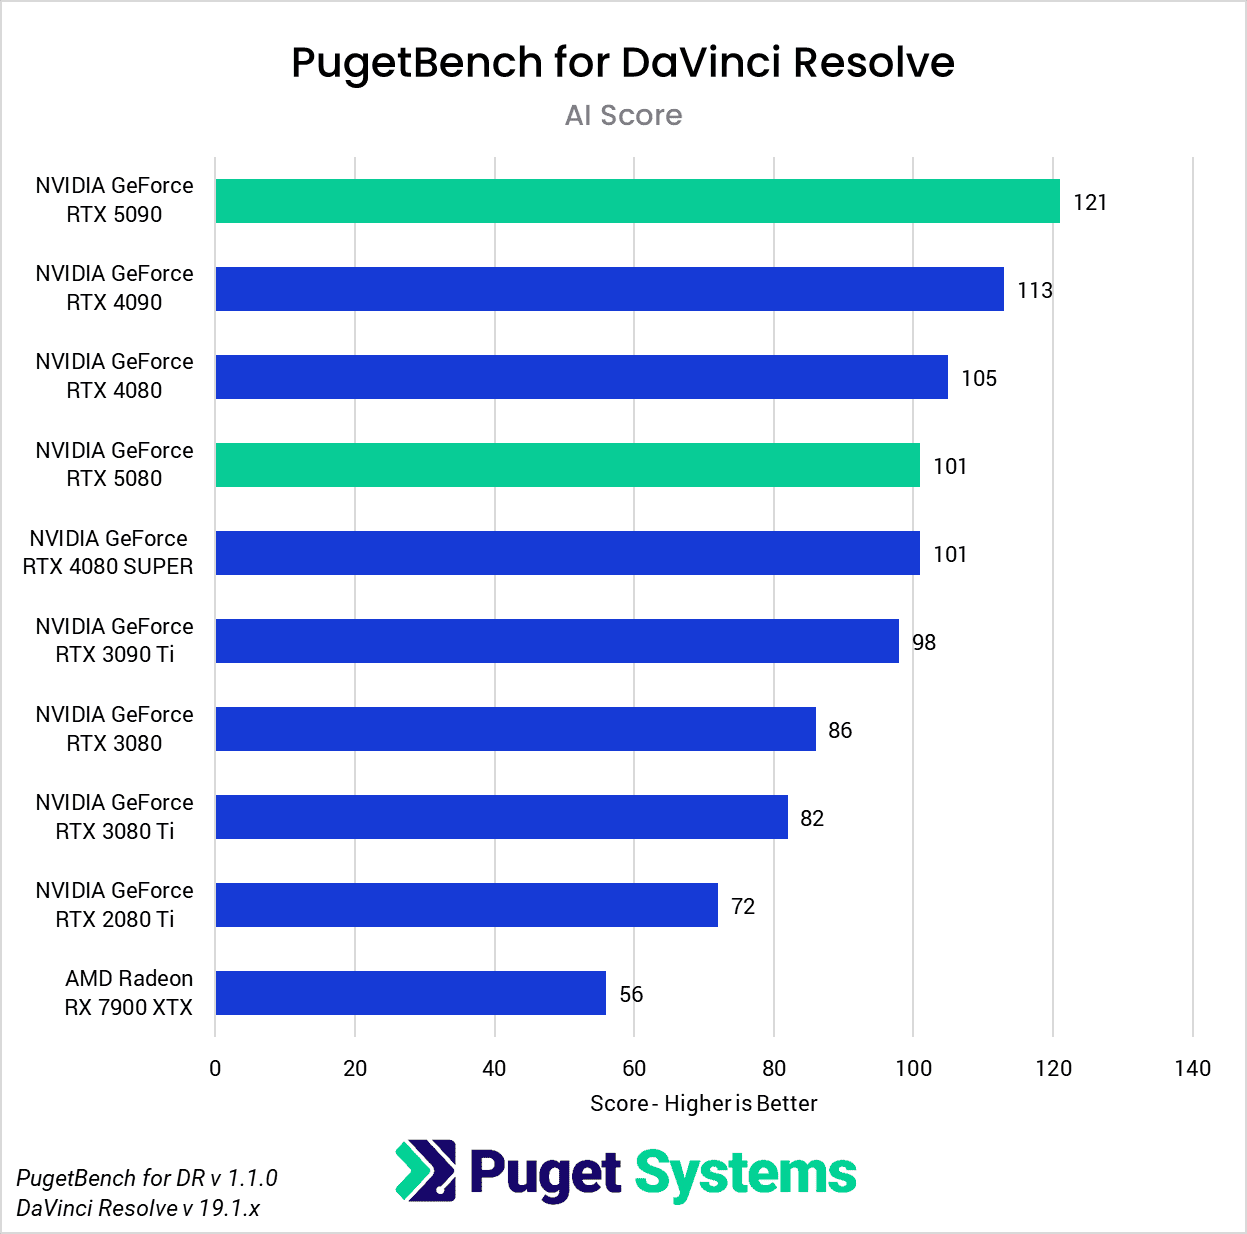
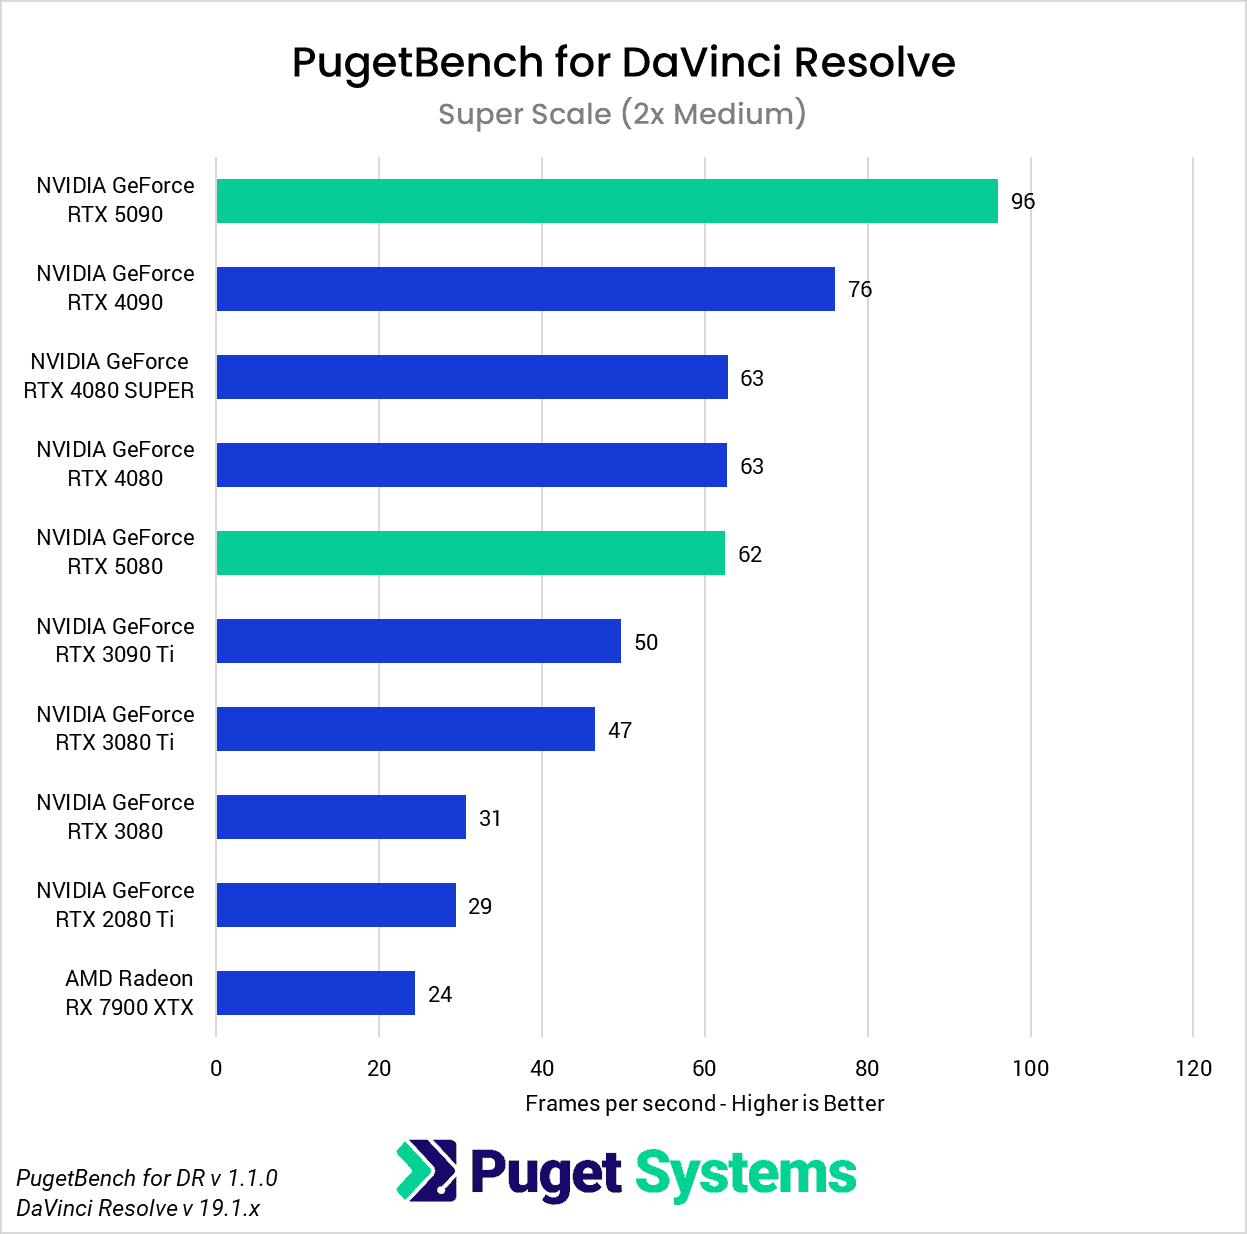

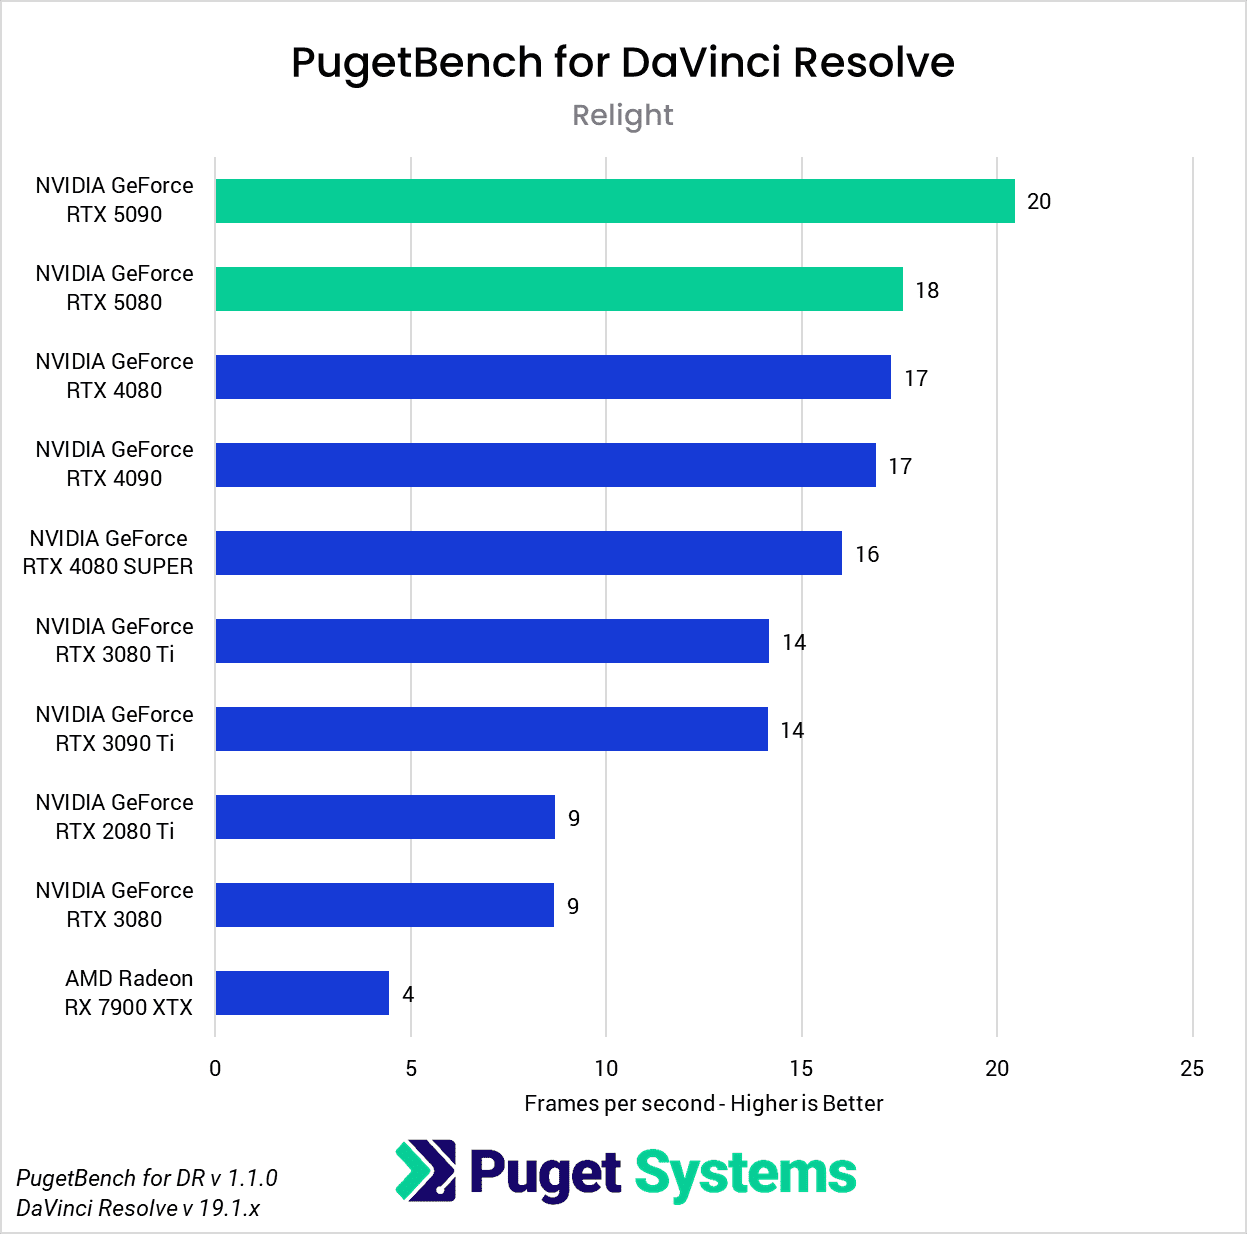
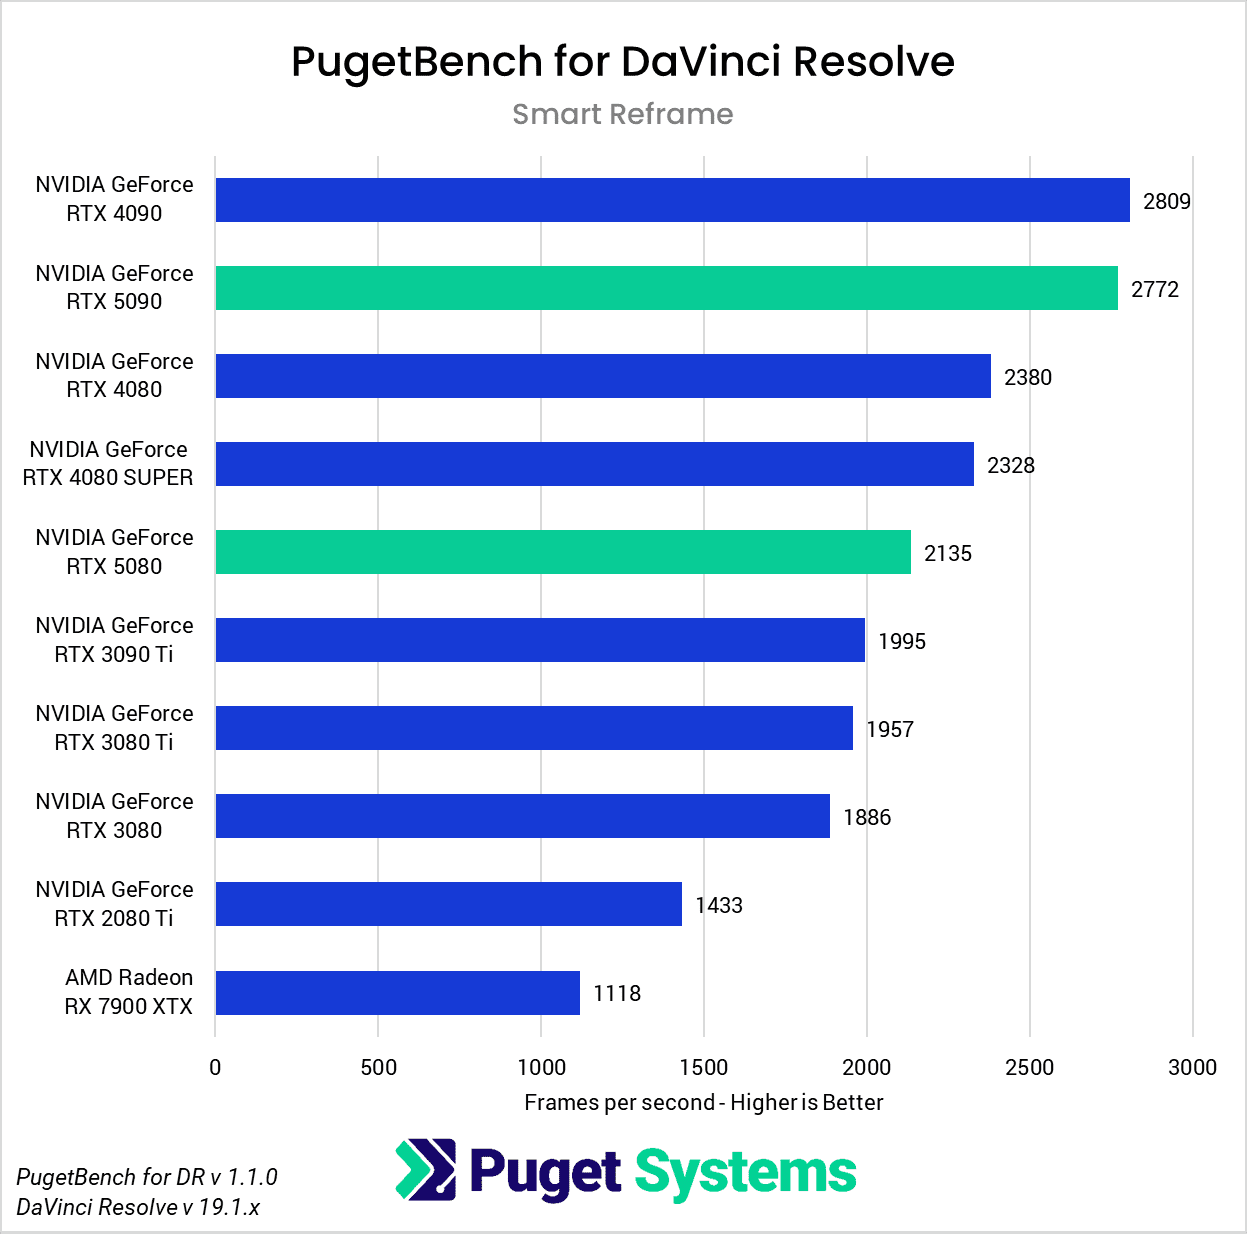
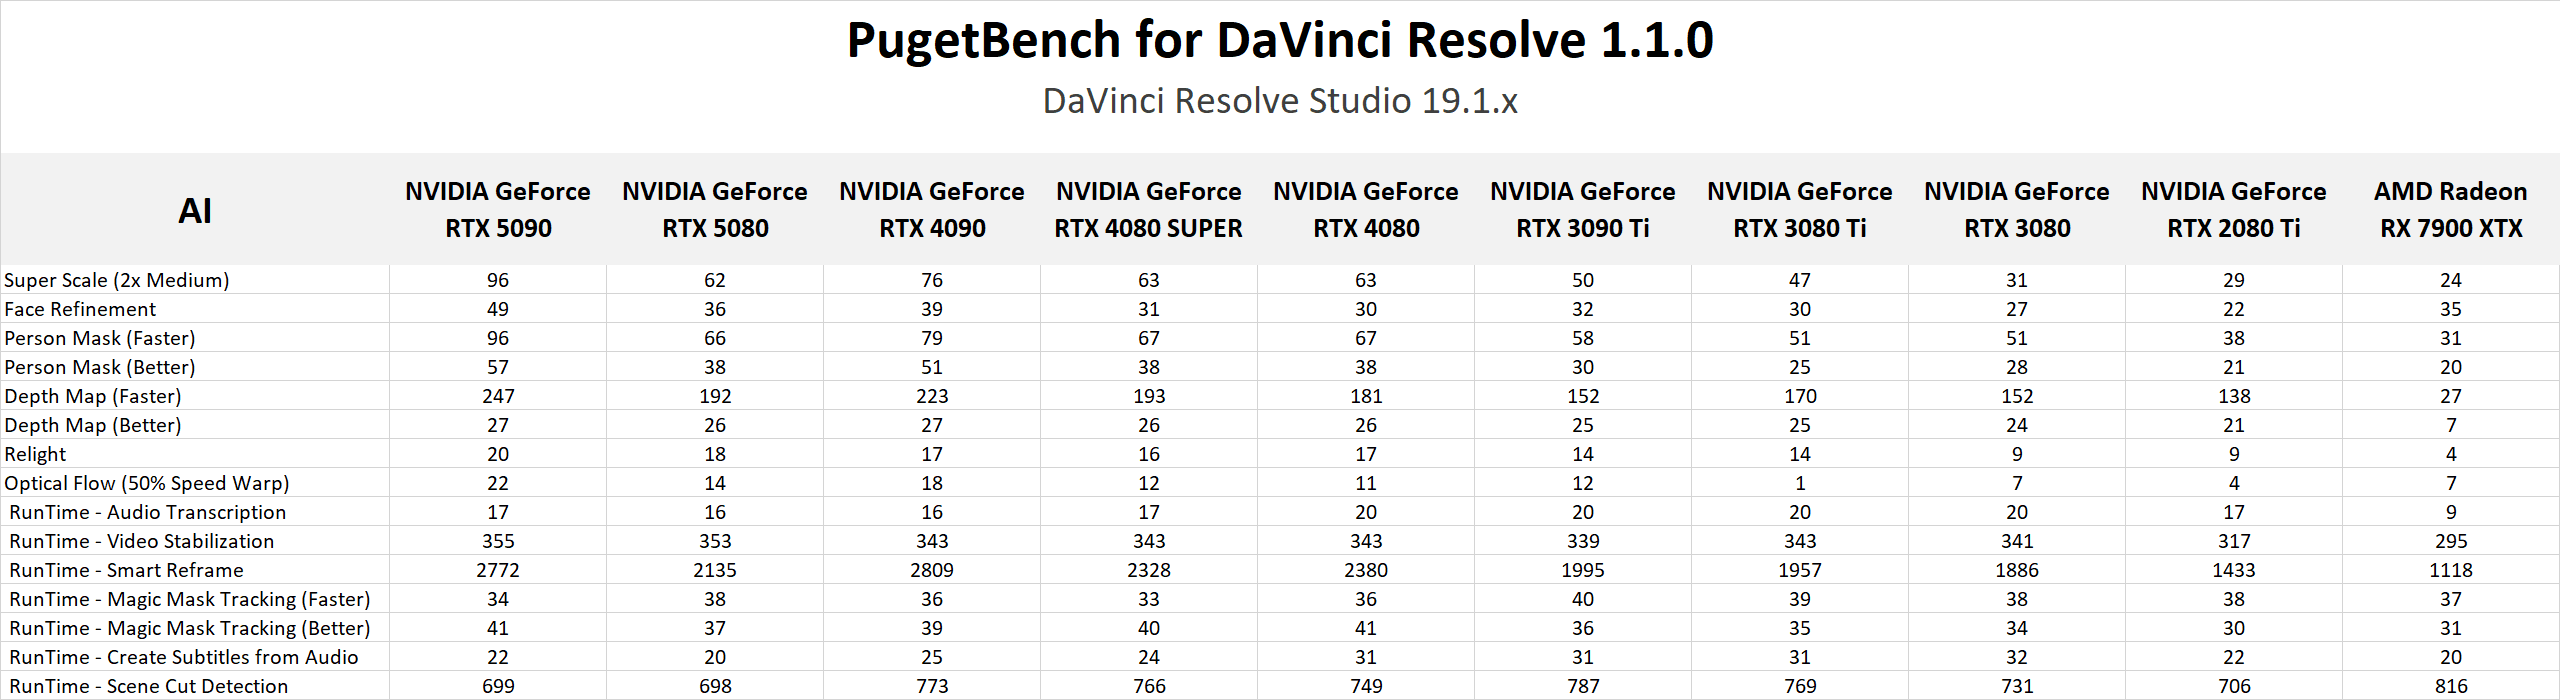
DaVinci Resolve is the first example of a closed-source commercial application included in our AI review. These tests are performed as part of the “Extended” preset in PugetBench for DaVinci Resolve. Instead of including charts for every individual test, we chose a selection that highlights the results with the largest differences between GPUs. However, a table with all the results is included in the last image.
Overall, the RTX 5090 performed well, consistently outpacing the RTX 4090 in the “Render” class of tests. Compared to the RTX 4090, the RTX 5090 was able to achieve a performance lead of about 20-25% in five out of eight Render tests: Super Scale, Face Refinement, Person Mask (Faster), Relight, and Optical Flow. However, in the “Runtime” tests, the RTX 5090 was typically within about ± 5% of the RTX 4090, and fell behind by about 10% in two tests: Create Subtitles from Audio and Scene Cut Detection. However, the results from these particular tests fall outside expectations; for example, the RTX 3080 took the top spot in the Create Subtitles from Audio Test.
The RTX 5080 was unable to strongly differentiate itself from the RTX 4080 variants and had very similar performance overall. It was able to pull ahead in the Face Refinement and Optical Flow tests, outperforming the RTX 4080 SUPER by about 13.5% and 20% in those tests, but by and large, the RTX 5080 performs in line with the 4080 variants in this benchmark. Unlike the RTX 5090, which provides the additional benefit of increased VRAM capacity compared to its predecessor, the RTX 5080 doesn’t distinguish itself as an attractive upgrade from the RTX 4080 SUPER and RTX 4080 for DaVinci Resolve AI workloads.
Video: Topaz Video AI
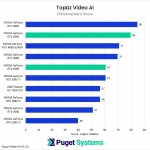
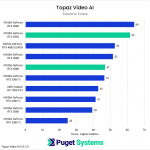
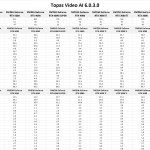


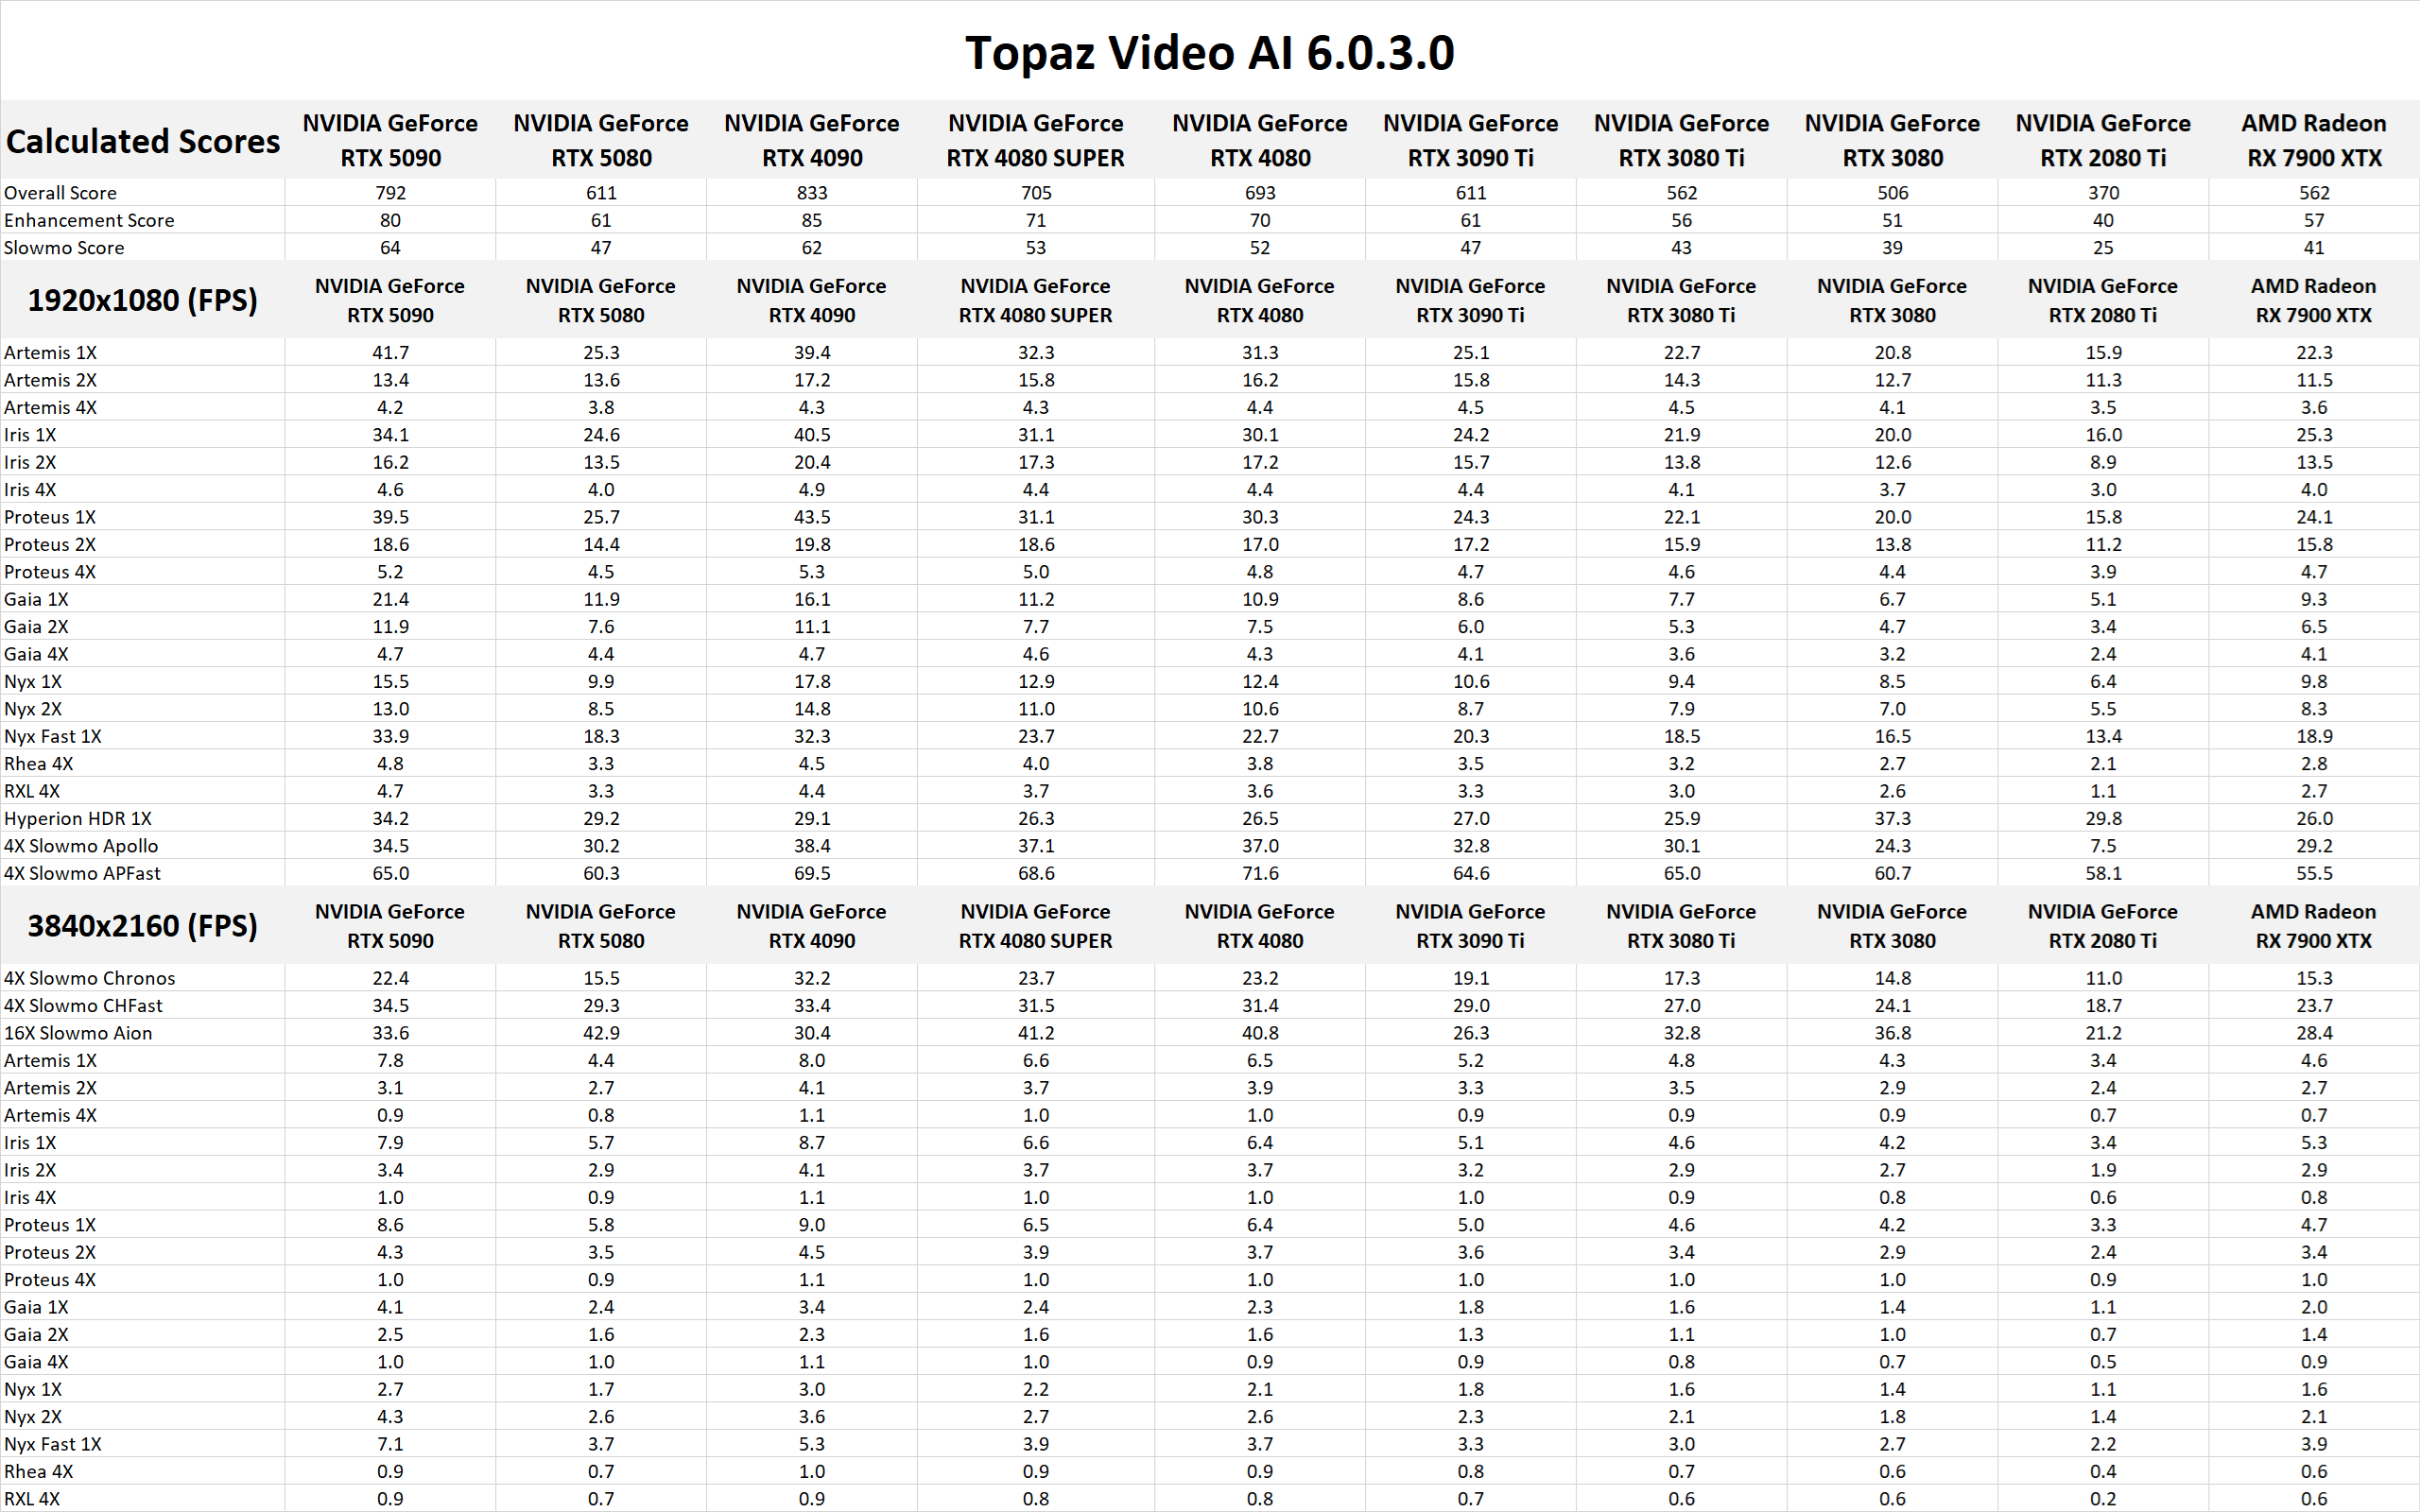
As our final benchmark in this review, we have another commercial application: Topaz Video AI, which is popular for tasks like upscaling and frame interpolation. For more details on how our scoring works for Topaz Video AI, please see our previous analysis here. Just like in that article, we provide an “Overall” result, along with “Enhancement” and “Slowmo” subscores. Additionally, we have provided the raw results for anyone interested in the details of specific tests.
Overall, the Topaz Video AI results for both of the 50-series GPUs were disappointing. In many cases, the RTX 5090 was unable to keep up with the RTX 4090, much less beat it by a meaningful margin, and the same can be said for the RTX 5080 versus the RTX 4080 & 4080 SUPER. It’s clear that, while Blackwell support has been implemented, there is still room for optimization.
How Good is the NVIDIA GeForce RTX 50-Series for AI?
With 32GB of GDDR7 running at 1.79TB/s and impressive compute capabilities, the RTX 5090 is theoretically the best consumer GPU for AI workloads that money can buy. Likewise, although the RTX 5080 has disappointed some by maintaining a total of 16GB of memory, its compute and memory bandwidth improvements provide a respectable performance boost over the RTX 4080 / RTX 4080 SUPER. However, due to the immaturity of support on the software side currently, it’s difficult to give a proper assessment of the RTX 5090 and RTX 5080 for AI workloads. Hopefully, we will soon see better support in libraries like PyTorch, along with proper FP4 implementations in our favorite AI applications and models.
Until then, it’s hard to say definitively that the average user with existing 40-series hardware will benefit significantly from an upgrade. That will almost certainly change with time, and those with 30-series and older GPUs can be assured that an upgrade to Blackwell can net them significant performance improvements in AI/ML workloads even today.
If you need a powerful workstation to tackle the applications we’ve tested, the Puget Systems workstations on our solutions page are tailored to excel in various software packages. If you prefer to take a more hands-on approach, our custom configuration page helps you to configure a workstation that matches your exact needs. Otherwise, if you would like more guidance in configuring a workstation that aligns with your unique workflow, our knowledgeable technology consultants are here to lend their expertise.
Looking for an AI and Scientific Computing workstation?
We build computers tailor-made for your workflow.
Don’t know where to start?
We can help!
Get in touch with one of our technical consultants today.