Table of Contents
Introduction
On August 28, Intel launched its latest generation of the Xeon workstation processor family, featuring the Intel Xeon W-3500 and Intel Xeon W-2500 desktop workstation processors. This update to the Intel Xeon W-3400 and Intel Xeon W-2400 processors features increases in core count and cache as well as TDP while maintaining the core architecture of the Xeon W-3400 processors.
The HEDT content creation space has, for the last few years, been an area of weakness for Intel compared to its competition in AMD’s Threadripper and Threadripper PRO processors as AMD has offered superior single- and multi-core performance for a similar price tag. While we have seen Intel perform well in certain areas (particularly in scientific computing), they are, overall, starting well behind AMD.
One thing we want to note is that we only have a full retail sample of the top-end Intel Xeon w9-3595X 60-core. For the other models we are testing, we are using what are called “ES”, or pre-release parts. Since these are pre-production silicon, there is always the chance that the performance shown may be different than what you would get with a retail processor. In addition, performance can also change based on other aspects of the system including RAM speed, cooling, and a whole host of other factors. We are confident in the relative performance results between the CPUs we are testing, but you may see slightly different scores if you purchase a system with one of these processors.
The good news is that since we do have a retail Xeon w9-3595X, we are able to include results for both the ES and retail CPUs for that model, allowing us to get an indication of when (or if) there might be a difference in performance for the particular workloads we are testing.
If you are interested in how the basic specs and pricing of these CPUs compare to the last-gen or AMD’s Threadripper PRO processors, we have compiled the important specifications below. For more information on these processors, you can visit AMD’s Threadripper landing page and the Intel Xeon W Ark pages.
| CPU Model | MSRP | Cores | Base / Boost Clock (GHz) | TDP (W) | Memory | L2 / L3 Cache (MB) | Release Date |
|---|---|---|---|---|---|---|---|
| AMD Ryzen Threadripper PRO 7995WX | $10,000 | 96 | 2.5 / 5.1 | 350 | DDR5 5200 Mbps | 96 / 384 | Nov. 21, 2023 |
| AMD Ryzen Threadripper PRO 7985WX | $7,350 | 64 | 3.2 / 5.1 | 350 | DDR5 5200 Mbps | 64 / 256 | Nov. 21, 2023 |
| Intel Xeon w9-3595X | $5,900 | 60 | 2.0 / 4.8 | 385 / 462 | DDR5 4800 Mbps | 120 / 112.5 | Aug. 28, 2024 |
| Intel Xeon w9-3495X | $5,900 | 56 | 1.9 / 4.8 | 350 / 420 | DDR5 4800 Mbps | 112 / 105 | Feb. 15, 2023 |
| AMD Ryzen Threadripper PRO 7975WX | $3,900 | 32 | 4.2 / 5.3 | 350 | DDR5 5200 Mbps | 32 / 128 | Nov. 21, 2023 |
| Intel Xeon w9-3575X | $3,790 | 44 | 2.2 / 4.8 | 340 / 408 | DDR5 4800 Mbps | 88 / 97.5 | Aug. 28, 2024 |
| Intel Xeon w9-3475X | $3,740 | 36 | 2.2 / 4.8 | 300 / 360 | DDR5 4800 Mbps | 72 / 82.5 | Feb. 15, 2023 |
| Intel Xeon w7-3465X | $2,900 | 28 | 2.5 / 4.8 | 300 / 360 | DDR5 4800 Mbps | 56 / 75 | Feb. 15, 2023 |
| Intel Xeon w7-3565X | $2,690 | 32 | 2.5 / 4.8 | 335 / 402 | DDR5 4800 Mbps | 64 / 82.5 | Aug. 28, 2024 |
| AMD Ryzen Threadripper PRO 7965WX | $2,650 | 24 | 4.2 / 5.3 | 350 | DDR5 5200 Mbps | 24 / 128 | Nov. 21, 2023 |
| Intel Xeon w5-3535X | $1,689 | 20 | 2.9 / 4.8 | 300 / 360 | DDR5 4800 Mbps | 40 / 52.5 | Aug. 28, 2024 |
| Intel Xeon w5-3435X | $1,589 | 16 | 3.1 / 4.7 | 270 / 324 | DDR5 4800 Mbps | 32 / 45 | Feb. 15, 2023 |
Much like the recent Intel Core 14th gen launch, the new Intel Xeon processors are an incremental upgrade to the previous generation W-3400 family. The largest change is that each tier of processor gained 4 or 8 cores, which should increase their performance in heavily threaded workflows.
Alongside this came an increase in base TDP and, consequently, max boost power draw to keep the cores sufficiently fed. Similarly, the increase in the number of cores brings a small increase in the total L2 and L3 cache. There were also some slight changes to base and boost clocks, but nothing large enough to be noteworthy.
Test Setup
AMD WRX90 Platform
| CPUs: AMD Ryzen Threadripper PRO 7995WX 96-Core AMD Ryzen Threadripper PRO 7985WX 64-Core AMD Ryzen Threadripper PRO 7975WX 32-Core AMD Ryzen Threadripper PRO 7965WX 24-Core |
| CPU Cooler: Asetek 836S-M1A 360mm |
| Motherboard: Asus Pro WS WRX90E-SAGE SE BIOS version: 0502 |
| RAM: 8x DDR5-5600 16GB (128 GB total) Running at 5200 Mbps |
| Power Profile: Balanced |
Universal Platform Components
| GPU: NVIDIA GeForce RTX 4080 16GB Driver Version: Studio 555.99 |
| PSU: Super Flower LEADEX Platinum 1600W |
| Storage: Samsung 980 Pro 2TB |
| OS: Windows 11 Pro 64-bit (22621) |
Intel W790 Platform
| CPUs: Intel Xeon w9-3595X 60-Core Intel Xeon w9-3575X 44-Core (ES) Intel Xeon w7-3565X 32-Core (ES) Intel Xeon w5-3535X 20-Core (ES) Intel Xeon w9-3495X 56-Core Intel Xeon w9-3475X 36-Core Intel Xeon w7-3465X 28-Core Intel Xeon w5-3435X 16-Core |
| CPU Cooler: Noctua NH-U14S DX-4677 |
| Motherboard: ASUS Pro WS W790E-SAGE SE BIOS version: 1401 |
| RAM: 8x DDR5-4800 16GB (128 GB total) Running at 4800 Mbps |
| Power Profile: High Performance |
Benchmark Software
| Photoshop 25.9.1 – PugetBench for Photoshop 1.0.1 |
| After Effects 24.5 – PugetBench for After Effects 0.96 |
| Premiere Pro 24.5 – PugetBench for Premiere Pro 1.0.1 |
| DaVinci Resolve 18.6.6.7 – PugetBench for DaVinci Resolve 1.0 |
| Unreal Engine 5.3 |
| Cinebench 2024 |
| V-Ray 6.00.01 |
| Blender 4.0 |
| RealityCapture |
In order to try and keep our results as comparable as possible, we standardize on a base setup on all of our testbeds, which closely aligns with the content creation workstation specs we recommend. As a part of this, we keep our memory running at the officially supported JEDEC RAM speeds, disable overclocking features, and enforce power limits; as part of this, all of the Xeon processors were run with PL1 = TDP, PL2 = 1.2*TDP (the second number listed in the specs table), and Tau = 32 s.
While most of our test beds use air coolers—we have found them to be sufficient for most processors with the above BIOS settings while providing better reliability—we have transitioned our Threadripper 7000 (PRO and otherwise) to 360mm AIOs to keep them sufficiently cool; we did find little performance gain, though. Interestingly, despite the higher power targets for the new Xeon processors, we have found them to run very coolly on our standard Noctua NH-U14S, so we have kept those on air cooling.
One other difference to be aware of in our testing is power plans. Typically, all of our testing is done on the “Balanced” Windows power plan. This plan is our recommendation for most professional end-users as it reduces idle power draw while typically not impacting performance. However, testing with the current Xeon processors (and in line with past Xeons) reveals a large performance gain from operating with the “High Performance” power plan of 15-20% in light- and moderately-threaded workloads. AMD (and even Intel Core) do not see any significant performance difference with these power plans, and due to this, the Threadrippers were tested on the former power plan and the Xeons on the latter.
In terms of software, we are using our standard suite of benchmarks for this review, plus the addition of our current work-in-progress RealityCapture benchmark. This suite includes many of our own PugetBench benchmarks as well as several other real-world benchmarks like Blender and V-Ray.
Motion Graphics: Adobe After Effects
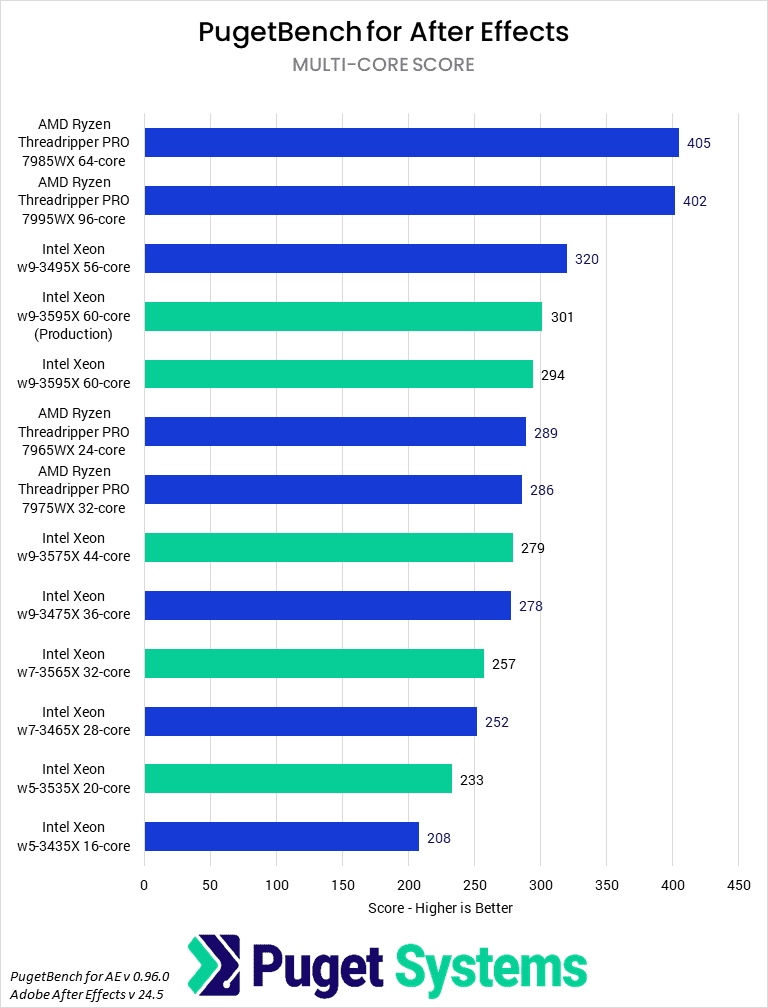
Although After Effects is historically a lightly-threaded application, over the last few years, Adobe has dramatically increased the capacity of the application to make use of high-end hardware, particularly multi-core CPUs. Workflows that make use of the multi-frame rendering feature (MFR) can scale heavily with a number of cores and also typically demand large amounts of RAM. This provides an area where a workstation-class CPU like an Intel Xeon W-3500 or AMD Ryzen Threadripper PRO processor can be a real value add.
There are still a lot of workloads in After Effects that are primarily single-core or GPU bound, though, so we break down our benchmark to look at a number of different aggregated sub-scores to highlight different types of workflows and how different CPUs may perform—for brevity, we have included the two most relevant to this review above. The Overall Score (Chart #2) is the best number for most people to look at, as it covers a wide variety of projects that best align with a typical user. If you are looking at Intel Xeon W CPUs, though, you likely work with much heavier, more complex projects, best represented by the Multi-Core Score (Chart #1).
Starting with the Multi-Core Score, Intel largely remains stagnant from the Xeon W-3400 to the Xeon W-3500 series processors. Oddly, we found that the 3495X outperformed the 3595X by 6%—just outside our typical margin for error. Beyond this, performance is largely identical save for a 12% uplift at the low end. AMD continues to provide the best performance in this test, although given the price difference between the CPUs, Intel’s w9 processors offer the best value at the high end.
Moving on to the Overall score, AMD’s superior single-threaded performance puts the Threadripper PRO 7000 WX-Series processors in a solid lead of 21%. For most users, the 24-core 7965WX is the best value for After Effects, although a desktop CPU would likely be an even better option.
Video Editing: Adobe Premiere Pro
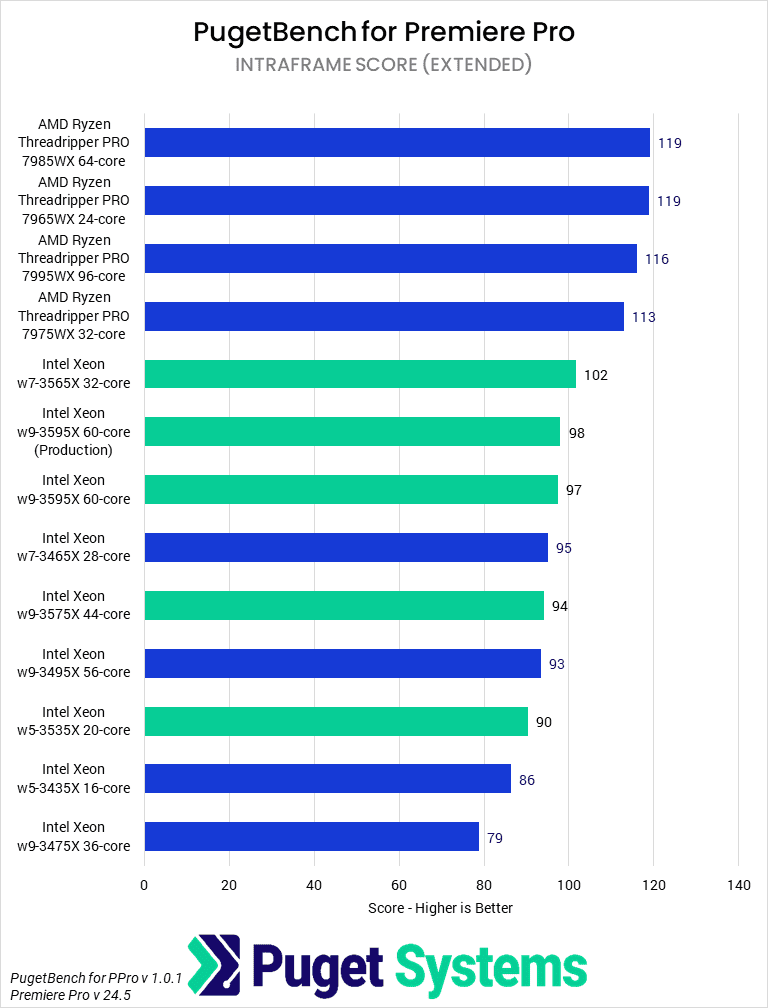
Unlike photo editing or the rendering engines we will get to later, video editing applications tend to be one of the most complex types of programs we test for CPUs. Premiere Pro supports a large variety of media and features, all of which take advantage of hardware differently but which are not all required for any one end user. Thus, the best CPU to use depends on the type of media and effects an end user is working with. Due to this, we break down the test into a number of sub-results, primarily by media codec.
Starting off by looking at the overall score (Chart #1) we see that the new Xeon processors outperform their last-gen counterparts by a small amount and, promisingly, appear to suffer relatively less from performance degradation at odd core counts (compare the 36-core 3475X to the 44-core 3575X). Nonetheless, they are still slower across the board than AMD’s Ryzen Threadripper PRO chips.
This relative performance stack is fairly consistent across the three sub-tests we looked at in this review, with the exception of RAW codec performance (Chart #4) where the new Xeons all manage to outperform the 7975WX. Intel has made little to no generation improvements in Premiere Pro, which is unsurprising given the limited multi-core scaling present in this application.
Video Editing / Motion Graphics: DaVinci Resolve Studio
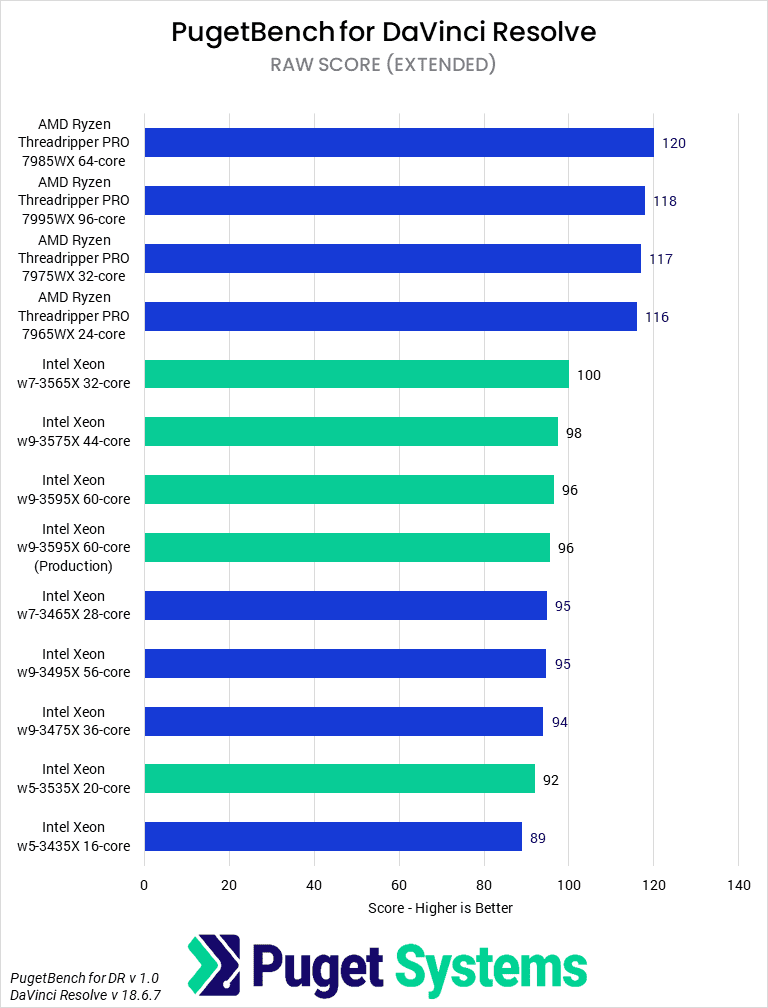
Much like Premiere Pro, DaVinci Resolve has a lot of factors to examine when trying to figure out CPU performance. In addition to the different needs of differing codecs, it also supports motion graphics and VFX work in Fusion (Chart #5) as well as a robust set of “AI” features (Chart #6). Typically, LongGOP media (Chart #2) tends to rely on accelerators in a GPU or iGPU for performance, while Intraframe media (Chart #3) is CPU-bound. RAW media (Chart #4) is partially GPU-accelerated and partially CPU-dependent, while Fusion is primarily single-threaded.
Despite the diverse types of workloads in DaVinci Resolve, the new Xeon processors once again fail to upset AMD’s dominance in this workload. The Threadripper PRO 7000 WX-series processors take the top four spots in each chart, with performance leads between 2 and 16%. Intel has made small gains with the Xeon W 3500 processors, but not enough to let them overtake AMD.
Much like the previously tested applications, perhaps the most impressive thing about the new Xeon generation in this workflow is that Intel seems to have resolved the issue of weirdly poor performance from some of their SKUs with high (or otherwise odd) core counts.
If you are looking for a DaVinci Resolve workstation and need the additional power from a HEDT processor, AMD’s 7995WX or 7965WX are the best overall CPUs.
Graphic Design: Adobe Photoshop
Next up, we have Adobe Photoshop. To be completely clear, this is not a targeted type of workload for this class of CPU. Photoshop is a lightly threaded application that is reliant on single-core performance and sensitive to latency. Even low-end consumer CPUs can provide sufficient performance in Photoshop, and, at the high end, a chip like the AMD Ryzen 9700X or Intel Core i9-14900K will give much better performance for a much more stomachable cost. For reference, the Overall Score for the Ryzen 9700X was 11,482 in our recent testing which is 35% faster than even the fastest Threadripper or Xeon CPU we tested.
This extends to most of our content creation applications but is most notable in Photoshop. Although most users won’t be going for an Xeon-class processor for content creation in general, there are some use cases where Photoshop could still be a secondary application, so we think it can be useful to test.
One of the quirks of Photoshop being lightly threaded and latency-sensitive is that CPUs with fewer cores tend to perform better, whether due to increased boosting or decreased latency from bouncing between cores on different tiles / CCDs; bearing in mind the specs we reviewed earlier helps to explain some of the results we saw. AMD’s Ryzen Threadripper PRO chips hold a dominant position over Intel’s Xeon chips, new and old. Since the boost clocks on the Xeon CPUs remained effectively identical gen-on-gen, the performance remained similarly identical, with the lowest core count, 3535X, matching the last-gen 3435X and leading the pack of Xeons. The high results of the w5 models are a bit unusual, as all the Xeons should perform relatively on par since they have similar maximum Turbo Boost clock speeds. This is something we want to look into more, and if we get more information, we will update this post.
Nonetheless, we want to again reiterate that no one is likely going to buy any of these CPUs exclusively for Photoshop. A dedicated Adobe Photoshop workstation likely starts with a Ryzen desktop CPU and, while it does frequently see use as a secondary application, any of these CPUs are wholly sufficient for occasional Photoshop use and the primary application—like VFX or rendering applications—should be the driving factor in a purchase.
Game Dev / Virtual Production: Unreal Engine
Epic’s Unreal Engine is one of the largest game engines currently in use and has seen widespread adoption in related industries like game dev, virtual production, virtual reality, and 3D visualization. Although, when working within the software, most of it is GPU accelerated, there are still a variety of other tasks that rely on the CPU. Of these, we currently test shader compilation, light baking, and compiling the engine in Visual Studio. All of these tend to be designed to take advantage of as many CPU cores as possible.
Shader Compilation (Chart #1) and Source Code Compile (Chart #3) are similar enough in structure that we can discuss them together. In both cases, the new Xeon W-3500 processors see a generational uplift of 10-15%, depending on the SKU, which is typically sufficient to push them above the Threadripper processors they were previously nearest to in terms of performance. Unfortunately for Intel, after the release of the Threadripper PRO 7000 WX-series of processors, the nearest performance competitors were typically one SKU down the stack; the 60-core Xeon w9-3495X compared best to the 32-core AMD 7975WX, the 3475X to the 7965WX, and the 3435X to the non-Threadripper AMD Ryzen 9 7950X. This means that AMD still has a stark lead with their 64- and 96-core processors, which complete the task in about two-thirds the time as Intel’s best showing.
Moving on to building lighting has even worse results for the new Xeon processors. Here, every Threadripper PRO CPU that we tested outperforms Intel’s fastest result. However, we do want to caution that, of late, our light baking benchmark has been somewhat finicky, with a number of CPUs effectively unable to complete it (see the 3435X and 3535X results) or else giving a very inconsistent performance. We are looking to re-make this portion of the benchmark, but for now, AMD has a respectable lead over Xeon in this workload, given our testing.
CPU Rendering: Cinebench 2024
Much like the game dev and coding tasks we examined in the last section, CPU rendering (which we will look at a number of apps for in the following sections) allows processors to stretch their legs—or cores—compared to the previous video editing and motion graphics benchmarks. CPU-based rendering favors CPUs with high core counts like Xeon, Threadripper, and Epyc while also taking advantage of their large RAM capacity. Although many users are shifting to GPU rendering, CPU rendering can still be important where GPUs aren’t supported, projects are too large for the available VRAM, or when the CPU result is preferable.
In Redshift / C4D (the renderers Cinebench 2024 is based on), AMD holds a strong per-core advantage. Since the application scales well to many cores, this gives the AMD Ryzen Threadripped PRO 7995WX a commanding position at the top of the pile, with scores 70% above the 60-core Xeon and 15% above the 64-Core Threadripper. This does make the 7995WX an extravagant CPU, given its large price tag, but it is the best available CPU. Unfortunately for Intel, the 64-Core 7985WX is nearly 50% faster than the 3595X for only 25% more money, likely the best overall CPU in this benchmark.
However, Intel does see good gen-on-gen performance uplifts of 15% in Cinebench 2024, largely due to the increased core counts of the new CPUs. This allows the new Xeons to better match AMD’s lower core-count offerings, with the 3595X beating out the 7975WX and the 3575X surpassing the 7965X, though both of these come at a hefty price discrepancy.
Much to the continued chagrin of our resident in-house 3D Rendering Analyst, we continue to include single-threaded Cinebench performance (Charts #2) in the Rendering section. Despite no one doing single-threaded CPU rendering, the Single-threaded score does act as a proxy for many modeling and animation workflows. AMD continues to have a better single-core performance by about 10%, but Intel has slightly closed the gap. More impressively, Intel appears to have solved past issues with high core-count CPUs experiencing a large penalty to single-threaded performance, whether due to processor groups, scheduling, or boosting, allowing the 60-core processor to be the highest-performing Xeon we tested.
CPU Rendering: V-Ray

Like Cinebench, V-Ray is a rendering engine that supports both CPU and GPU rendering, and one in which AMD has historically had the advantage. The 7995WX is, once again, the best CPU in its class, scoring 74% higher than the 3595X due to its 50% higher core count (and nearly 100% higher cost). Comparing the 64-Core 7985WX to Intel’s 60-Core 3595X, AMD still has a 30% lead, though this is more in line with the 25% price difference.
On the lower end, things get more interesting, with the 32-core AMD 7975WX barely beating the 44-core Intel 3575X, while the 32-core 3565X leapfrogs over the 24-core AMD 7965WX from its last-gen counterpart. While AMD still holds a strong advantage in V-Ray, Intel made impressive 20% generational improvements in this application.
CPU Rendering: Blender

Blender is the final rendering engine we typically examine in these reviews. Although all three engines tend to scale well with multiple cores, we sometimes see different performance behavior between them due to their different designs. In this case, our Blender results appear more similar to those of Cinebench than those of V-Ray.
Like Cinebench, the 7995WX and 7985WX are the two highest-performing CPUs, with scores 94% and 50% higher than the Intel 3595X, respectively. Both of these CPUs are more expensive than the 3595X, but in this case, they are notably better values. The 44-Core 3575X is 12% slower than the 32-Core AMD 7975WX, while the 32-Core Intel 3565X is slightly behind the 24-Core AMD 7965WX.
Intel manages a 10-15% gen-on-gen performance improvement due to the additional cores, which is on par with the gains in Cinebench but behind that of V-Ray. Overall, AMD is still dominant in this benchmark in terms of performance and performance per dollar.
RealityCapture
A new entry to our benchmark suite, Reality Capture is a photogrammetry software currently owned by Epic—it converts photographs and/or laser scans into 3D models using a mixture of CPU and GPU resources. Our in-development benchmark looks at a variety of the most time-consuming tasks in the Reality Capture process (aligning Images, reconstruction in preview mode, reconstruction in normal/high detail, and texturing) across a variety of project sizes (from a small object to a large area).
Due to how we are currently calculating scores, the Overall Score (Chart #1) is dominated by the performance in “Reconstruction in Normal/High Detail” (Chart #4) as in our testing, this step takes the majority of the time in the process of going from raw images to a final, textured 3D-model. As this is the case, we will primarily look at the subscores while noting that AMD is on par or better than any Intel CPU in our Overall Score.
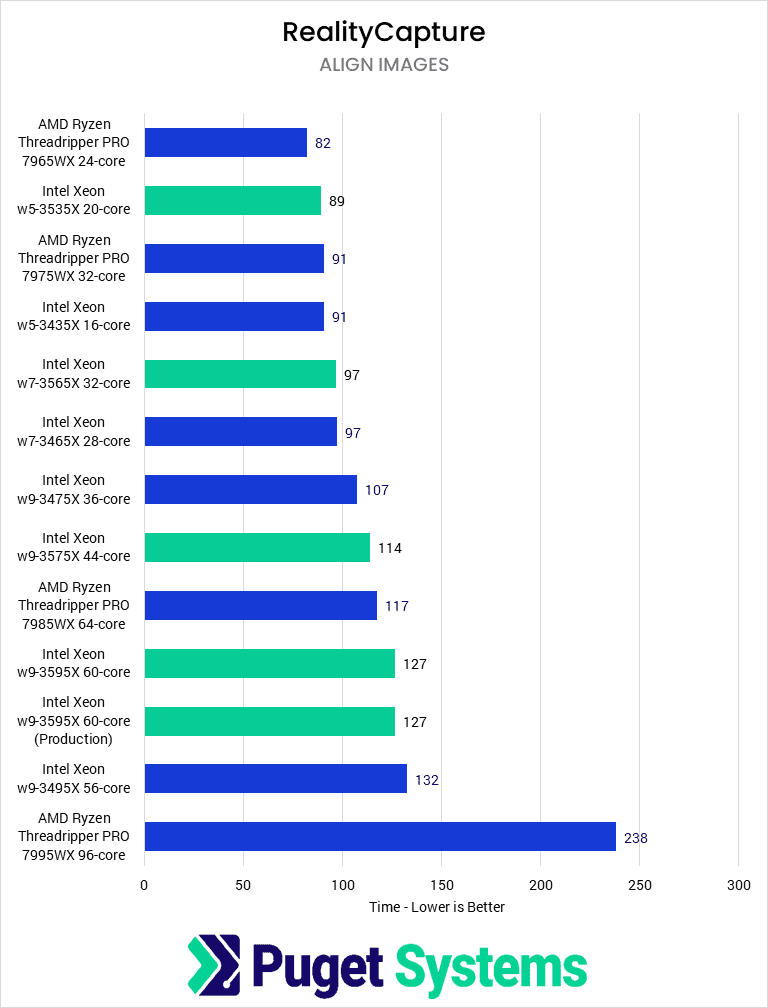
Aligning images is the first major step in the photogrammetry process, and it scales with the number of photos used. It appears to primarily be single-thread limited, as the lower core-count CPUs perform better. The 7965WX leads here with a slight advantage over the 3535X. However, we see basically no generational improvement in this test, and Intel and AMD tend to match each other in terms of performance by core count. Of note, the 7995WX performed particularly poorly in Alignment, taking nearly twice the time to complete as the second-slowest 3495X.
Reconstructing in preview mode (Chart #3) is the next step we examined. It tends to be the quickest step of the four we examined, with times between one-half and one-third Aligning Images. Here, all of AMD’s CPUs (save the 7995WX, which once again performed very poorly) scored identically, finishing about six seconds (17%) faster than the Intel CPUs, all of which performed nearly identically to each other. In general, all of the CPUs are very similar in this step.
In contrast, reconstructing in normal/high detail (Chart #4 is a geomean of both across the projects) was the longest step we tested. This step took hours to complete for larger projects, even for the highest core-count CPUs. Here, the higher core-count CPUs do much better, with the 96-core 7995WX having the lowest time to complete—6% faster than the 7985WX and 18% faster than the 3575WX. The remaining W9s make up the next grouping, all performing similarly to each other and slightly behind the 3575X. We are unsure why the 3595X did not perform better in this test. The remaining Threadrippers comprise the next cluster alongside the 3565Xm, with the lower core-count Xeons trailing further behind.
Texturing (Chart #5) performed very similarly to Reconstructing in preview mode, with all Threadrippers save for the 96 core performing similarly and ahead of the fastest Xeons. Although there is some differentiation between the various Xeons, the range is less than the gap between the 7965WX and the 3595X, so they are similar enough not to require further examination.
Overall, which CPU is best for RealityCapture depends on the distribution of time an individual project takes. In general, a low-end Threadripper like the 7965WX may be best for smaller projects on a budget, while the 7995WX is ideal for very large, complex projects. In either case, while Intel’s Xeon CPUs are competent, they fail to excel in either use case compared to the competition.
How good are the Intel Xeon W-3500 processors for content creation?
The new Intel Xeon W-3500 family of processors is a fine refresh to an existing product stack but leaves a lot to be desired if Intel wants to compete with AMD in the HEDT space for Content Creation. As is typical, the performance gain depends a lot on the particular application, but, in general, gains are from 0-20% with a bias towards multi-threaded applications due to the increased core count.
Looking at our typical “media and entertainment” workflows with Photoshop, Premiere Pro, After Effects, and DaVinci Resolve, which are typically more lightly threaded, the new Xeon processors performed basically identically to their last-gen counterparts. The one caveat is that it appears previous issues with the models with unusual core counts (36 and 56, for example) performing poorly appear to have been largely resolved, meaning there is no longer much performance penalty to the higher core-count SKUs in moderate workflows. Still, AMD tends to offer the best performance in this area while being competitive performance per dollar.
For muli-threaded applications like CPU rendering, Unreal Engine tasks, code compilation, and Reality Capture, the new Xeons fare somewhat better with 10-15% performance gains over the previous generation. V-Ray, in particular, was an area of strength for Intel, with 20% gen-on-gen uplifts. However, these applications are also the ones where AMD has the strongest lead; In V-Ray, AMD approaches twice the performance at the top end, and a respectable 50% on a per-core basis.
One area we want to call out is scientific computing and HPC/ML applications. Although we did not test them in this review since it is focused on content creation, when the Zen4 Threadrippers launched, we found that the Xeon W-3400 CPUs had fantastic performance in some HPL benchmarks due to their AMX and BF16 support. We hope to revisit the Xeon W-3500s and their performance for scientific computing in the future, as we expect the “AMD vs. Intel” story to be very different for that type of workload.
Finding the perfect workstation doesn’t have to be complicated. Explore our solutions page for a curated selection of recommended systems for a multitude of applications and workflows, or visit our custom configuration page if you already know the ideal hardware for your needs. If you need assistance with tailoring a system to a unique workflow or have any other questions, we encourage you to reach out to our dedicated technology consultants.


