Table of Contents
TL;DR: Intel Xeon W-3400 vs. AMD Threadripper PRO 5000 WX-Series for Content Creation
Overall, the new Intel Xeon W-3400 series of processors are significantly faster than the previous generation, but this comes at the cost of much higher power consumption. And while the gen-over-gen performance is great in many cases, outside of a few isolated workloads, it is only enough to (at best) bring Intel on par with AMD’s Threadripper PRO 5000 WX-Series processors. In most cases, AMD maintains a small but measurable performance edge. This, combined with AMD’s lower power consumption, is going to make them a more attractive option than the new Xeon W-3400 processors for most content creation workflows.
While the Intel Xeon W-3400 processors are not particularly desirable for the workflows we tested in this article, we want to note that there are other areas where these CPUs should be terrific; most notably AI and machine learning. We plan to have some performance numbers for these processors in the near future, but our preliminary testing is looking extremely good for Intel. The Xeon W-3400 and W-2400 lines can also be a solid option for workflows that don’t need a lot of CPU power but do need lots of RAM or PCIe lanes. This is especially true for the W-2400 line, where there are CPU models like the Xeon w3-2435, which can get you 64 PCIe lanes (enough for 4 GPUs) for less than $700.
However, for content creation workflows where CPU performance matters, the AMD Threadripper PRO 5000 WX-Series processors will almost always be the better choice over the Intel Xeon W-3400 line.
Introduction
A few months ago, Intel announced the new “Sapphire Rapids” Xeon family of processors, encompassing the Intel Xeon W-2400, Intel Xeon W-3400, and the 4th Gen Intel Xeon Scalable CPUs. As is often the case with this class of product, however, the announcement was well ahead of the review embargo and even further ahead of when anyone was actually able to get their hands on it.
We were fortunate to have the opportunity to publish a preview of the W-3400 processors several months ago, where we took a look at the current state of performance at that time. But, since those results were with pre-launch CPUs, motherboards, and BIOS versions, we didn’t expect it to completely line up with what the performance would be with the final product. Today we are finally able to share our testing results with full retail motherboard, BIOS, and processors for content creation workflows.
In addition to using the final release versions of hardware, we are making a couple of other tweaks to our testing compared to what we did back in February. First, we updated the applications and benchmarks to match what we used in our recent Intel Xeon W-2400 Content Creation Review so that results could be directly compared between the Xeon W-2400 and W-3400 processor families. The only exception to this is Unreal Engine which we updated to support UE 5.1 after the W-2400 article. We felt it was more important to test the new version of Unreal than to have comparable results between the two Xeon processor families.
We also changed our CPU cooler from the beefy 3x120mm AIO liquid cooler that Intel provided and replaced it with our more standard Noctua NH-U14S DX-4677 140mm air cooler. We will cover thermals later in this article, but the short story is that this 140mm cooler is more than enough even for the Xeon w9-3495X 56-core CPU as long as you are not overclocking.
Before we get too far into this article, we want to clarify the difference between the W-2400 and W-3400 product lines because, at first glance, they may seem very similar:
| Intel Xeon | W-2400 (Mainstream Workstation Processors) | W-3400 (Expert Workstation 1S Processors) |
|---|---|---|
| Socket | LGA 4677 | LGA 4677 |
| CPU PCIe Lanes (Gen 5) | 64 | 112 |
| Memory Channels | 4 | 8 |
| Max Cores/Threads | 24/48 | 56/112 |
| Base Power | 110-225W | 270-350W |
| Max Memory | 2TB DDR5 | 4TB DDR5 |
| Overclocking | Select Models | Select Models |
As you can see, the W-3400 line is essentially an expanded version of the W-2400 line: double the memory channels and maximum memory capacity, a bit more than twice the maximum core count, and 112 PCIe lanes. Both processor lines use the LGA 4677 socket, although the heat spreaders are physically different, so you need a different heatsink carrier clip for each line.
CPUs from each family can go into the same motherboard, although differences in memory channels and PCIe lanes could mean some features may not work. For example, the ASUS Pro WS W790E-SAGE SE motherboard we are using has eight RAM slots, but with a W-2400 CPU, only half of them are functional.
Intel tends to provide a very broad product offering for Xeon, and these new lines are no different, with eight models in the W-2400 line and seven for the W-3400 line. This results in a large list of total CPUs, but in the chart below, we flagged the W-3400 in particular since those are what we are focusing on today. If you want to see the full specs of these new Intel Xeon W-3400 CPUs, we recommend checking out the Intel Ark page for Xeon W Processors.
| CPU Model | Cores/ Threads | Smart Cache (L3) | Max Frequency | Base Frequency | Max Memory Speed | Unlocked | Power (Base/Max) | MSRP |
|---|---|---|---|---|---|---|---|---|
| TR PRO 5995WX | 64/128 | 256MB | 4.5GHz | 2.7GHz | DDR4 3200 | Yes | 280W | $6,499 |
| w9-3495X | 56/112 | 105MB | 4.8GHz | 1.9GHz | DDR5 4800 | Yes | 350/420W | $5,889 |
| W-3375 | 38/76 | 57MB | 4.0GHz | 2.5GHz | DDR4 3200 | No | 270W | $4,951 |
| W-3365 | 32/34 | 48MB | 4.0GHz | 2.7GHz | DDR4 3200 | No | 270W | $3,851 |
| w9-3475X | 36/72 | 82.5MB | 4.8GHz | 2.2GHz | DDR5 4800 | Yes | 300/360W | $3,739 |
| TR PRO 5975WX | 32/64 | 128MB | 4.5GHz | 3.6GHz | DDR4 3200 | Yes | 280W | $3,299 |
| w7-3465X | 28/56 | 75MB | 4.8GHz | 2.5GHz | DDR5 4800 | Yes | 300/360W | $2,889 |
| W-3345 | 24/48 | 36MB | 4.0GHz | 3.0GHz | DDR4 3200 | No | 250W | $2,751 |
| w7-3455 | 24/48 | 67.5MB | 4.8GHz | 2.5GHz | DDR5 4800 | No | 270/324W | $2,489 |
| TR PRO 5965WX | 24/48 | 128MB | 4.5GHz | 4.0GHz | DDR4 3200 | Yes | 280W | $2,399 |
| w7-2495X | 24/48 | 45MB | 4.8GHz | 2.5GHz | DDR5 4800 | Yes | 225/270W | $2,189 |
| w7-3445 | 20/40 | 52.5MB | 4.8GHz | 2.6GHz | DDR5 4800 | No | 270/324W | $1,989 |
| w7-2475X | 20/40 | 37.5MB | 4.8GHz | 2.6GHz | DDR5 4800 | Yes | 225/270W | $1,799 |
| w5-3435X | 16/32 | 45MB | 4.7GHz | 3.1GHz | DDR5 4800 | Yes | 270/324W | $1,589 |
| W-3335 | 16/32 | 24MB | 4.0GHz | 3.4GHz | DDR4 3200 | No | 250W | $1,430 |
| w5-2465X | 16/32 | 33.75MB | 4.6GHz | 3.1GHz | DDR5 4800 | Yes | 200/240W | $1,399 |
| TR PRO 5955WX | 16/32 | 64MB | 4.5GHz | 4.0GHz | DDR4 3200 | Yes | 280W | $1,299 |
| w5-3425 | 12/24 | 30MB | 4.6GHz | 3.2GHz | DDR5 4800 | No | 270/324W | $1,189 |
| w5-2455X | 12/24 | 30MB | 4.6GHz | 3.2GHz | DDR5 4800 | Yes | 200/240W | $1,049 |
| W-3323 | 12/24 | 21MB | 3.9GHz | 3.5GHz | DDR4 3200 | No | 220W | $1,043 |
| w5-2445 | 10/20 | 26.25MB | 4.6GHz | 3.1GHz | DDR5 4800 | No | 175/210W | $839 |
| w3-2435 | 8/16 | 22.5MB | 4.5GHz | 3.1GHz | DDR5 4400 | No | 165/198W | $669 |
| w3-2425 | 6/12 | 15MB | 4.4GHz | 3.0GHz | DDR5 4400 | No | 130/156W | $529 |
| w3-2423 | 6/12 | 15MB | 4.2GHz | 2.1GHz | DDR5 4400 | No | 120/144W | $359 |
Compared to the previous Xeon W-3300 line, the new W-3400 processors are slightly more expensive at similar core counts, although the major increase in specs should more than compensate for the price increase. We will note, however, that MSRP can be misleading for this type of product, as these CPUs are intended to primarily be sold as a part of an entire workstation and not as individual parts. Because of that, pricing can change based on specific deals system integrators may have access to, but are also impacted by the markup applied by those same integrators.
In terms of specs, the W-3400 CPUs are very similar to their W-2400 counterparts at the same core count, although it is interesting how much higher wattage the W-3400 CPUs are. The w7-3425, for example, is almost identical to the w5-2455X in terms of core count, clock speed, and cache – but with dramatically higher power draw.
Test Setup
Intel Xeon W-3400 Test Platform
| CPUs: Intel Xeon w9-3495X 56-Core Intel Xeon w9-3475X 36-Core Intel Xeon w7-3455 24-Core Intel Xeon w5-3435X 16-Core |
| CPU Cooler: Noctua NH-U14S DX-4677 |
| Motherboard: ASUS Pro WS W790E-SAGE SE |
| Power Profile: High Performance |
| RAM: 8x Kingston DDR5-4800 ECC Reg. 1R 16GB (128GB total) |
| GPU: NVIDIA GeForce RTX 4080 16GB |
| PSU: Super Flower LEADEX Platinum 1600W |
| Storage: Samsung 980 Pro 2TB |
| OS: Windows 11 Pro 64-bit (22621) |
Intel Xeon W-3300 Test Platform
| CPUs: Intel Xeon W-3375 38-Core Intel Xeon W-3365 32 Core Intel Xeon W-3345 24-Core Intel Xeon W-3335 16-Core |
| CPU Cooler: Noctua NH-U14S DX-4189 |
| Motherboard: Supermicro X12SPA-TF 64L |
| Power Profile: High Performance |
| RAM: 8x Kingston DDR4-3200 ECC Reg. 1R 16GB (128GB total) |
| GPU: NVIDIA GeForce RTX 4080 16GB |
| PSU: Super Flower LEADEX Platinum 1600W |
| Storage: Samsung 980 Pro 2TB |
| OS: Windows 11 Pro 64-bit (22621) |
AMD Threadripper PRO Test Platform
| CPU: AMD Threadripper PRO 5995WX 64-Core AMD Threadripper PRO 5975WX 32-Core AMD Threadripper PRO 5965WX 24-Core AMD Threadripper PRO 5955WX 16-Core |
| CPU Cooler: Noctua NH-U14S TR4-SP3 (AMD TR4) |
| Motherboard: ASUS Pro WX WRX80E-SAGE SE WIFI |
| Power Profile: Balanced |
| RAM: 8x Micron DDR4-3200 16GB ECC Reg. (128GB total) |
| GPU: NVIDIA GeForce RTX 4080 16GB |
| PSU: Super Flower LEADEX Platinum 1600W |
| Storage: Samsung 980 Pro 2TB |
| OS: Windows 11 Pro 64-bit (22621) |
Intel Core 13th Gen Test Platform
| CPU: Intel Core i9 13900K 24-Core |
| CPU Cooler: Noctua NH-U12A |
| Motherboard: ASUS ProArt Z690E-Creator WiFi |
| Power Profile: Balanced |
| RAM: 2x DDR5-4800 32GB (64GB total) |
| GPU: NVIDIA GeForce RTX 4080 16GB |
| PSU: Super Flower LEADEX Platinum 1600W |
| Storage: Samsung 980 Pro 2TB |
| OS: Windows 11 Pro 64-bit (22621) |
Benchmark Software
| Photoshop 24.1.1 – PugetBench for Photoshop 0.93.6 |
| Lightroom Classic 12.2 – PugetBench for Lightroom Classic 0.94 |
| After Effects 23.2 – PugetBench for After Effects 0.95.6 |
| Premiere Pro 23.1.0 – PugetBench for Premiere Pro 0.95.6 |
| DaVinci Resolve 18.1.3 – PugetBench for DaVinci Resolve 0.93.2 |
| Unreal Engine 5.1 |
| Cinebench R23.2 |
| Blender 3.4.0 |
| V-Ray 5.02.00 |
To see how the new Xeon W-3400 processors perform, we will primarily compare them to similar core count models from the previous generation W-3300 line and AMD’s Threadripper PRO 5000 WX Series processors. In addition, we will also toss the Intel Core i9 13900K into the mix. This CPU is from a completely different family and, in many ways, doesn’t belong in a comparison between Xeon and Threadripper PRO products as it has less memory capacity and far fewer PCIe lanes. However, CPUs like the Core i9 13900K tend to be much faster for lightly threaded workloads like Photoshop, so we wanted to include it to provide context for where you might want to invest in a Xeon or Threadripper PRO platform and where a lower-cost option may be a better fit.
We will note that all our testing is done with workstation usage in mind. That doesn’t mean as much for the Xeon and Threadripper PRO platforms, since they are largely tuned out of the box for workstation use, but we do disable auto-overclocking features like MCE and enforce the P1/P2 power limits. We have a whole post going over why we do this if you want the details, but the summary is that it greatly reduces power draw and temperatures for a minimal impact on performance outside of a few specific workloads.
For the Intel Xeon platforms, we will be using the “High Performance” Windows power profile. The power profile doesn’t impact AMD Threadripper Pro or the Intel Core 13th Gen processors much, but, as we will show in the next section, it makes a massive performance difference for Intel Xeon and we consider it an essential setting.
Beyond the CPU and motherboards, we will be standardizing on the same GPU (NVIDIA GeForce RTX 4080), storage (Samsung 980 Pro 2TB), and OS (Windows 11 with the latest updates). We will use many of our PugetBench series of benchmarks along with several CPU rendering benchmarks to see how these processors perform under highly threaded workloads.
Windows Power Profile Impacts on Xeon W-3400 Performance
Before getting into our benchmark result analysis, we want to investigate how the Windows power profile affects performance. This has been a major factor with Intel Xeon CPUs for the last several generations and appears to continue with these new processors as well. The main issue is that lightly and moderately threaded workloads often see significant performance degradation if you use Windows’ default “Balanced” power profile. This setting is easy enough to change, but we generally perform our testing with as stock of settings as possible, so we wanted to take the time to show just how important it is to switch to the “High Performance” profile for Intel Xeon processors.
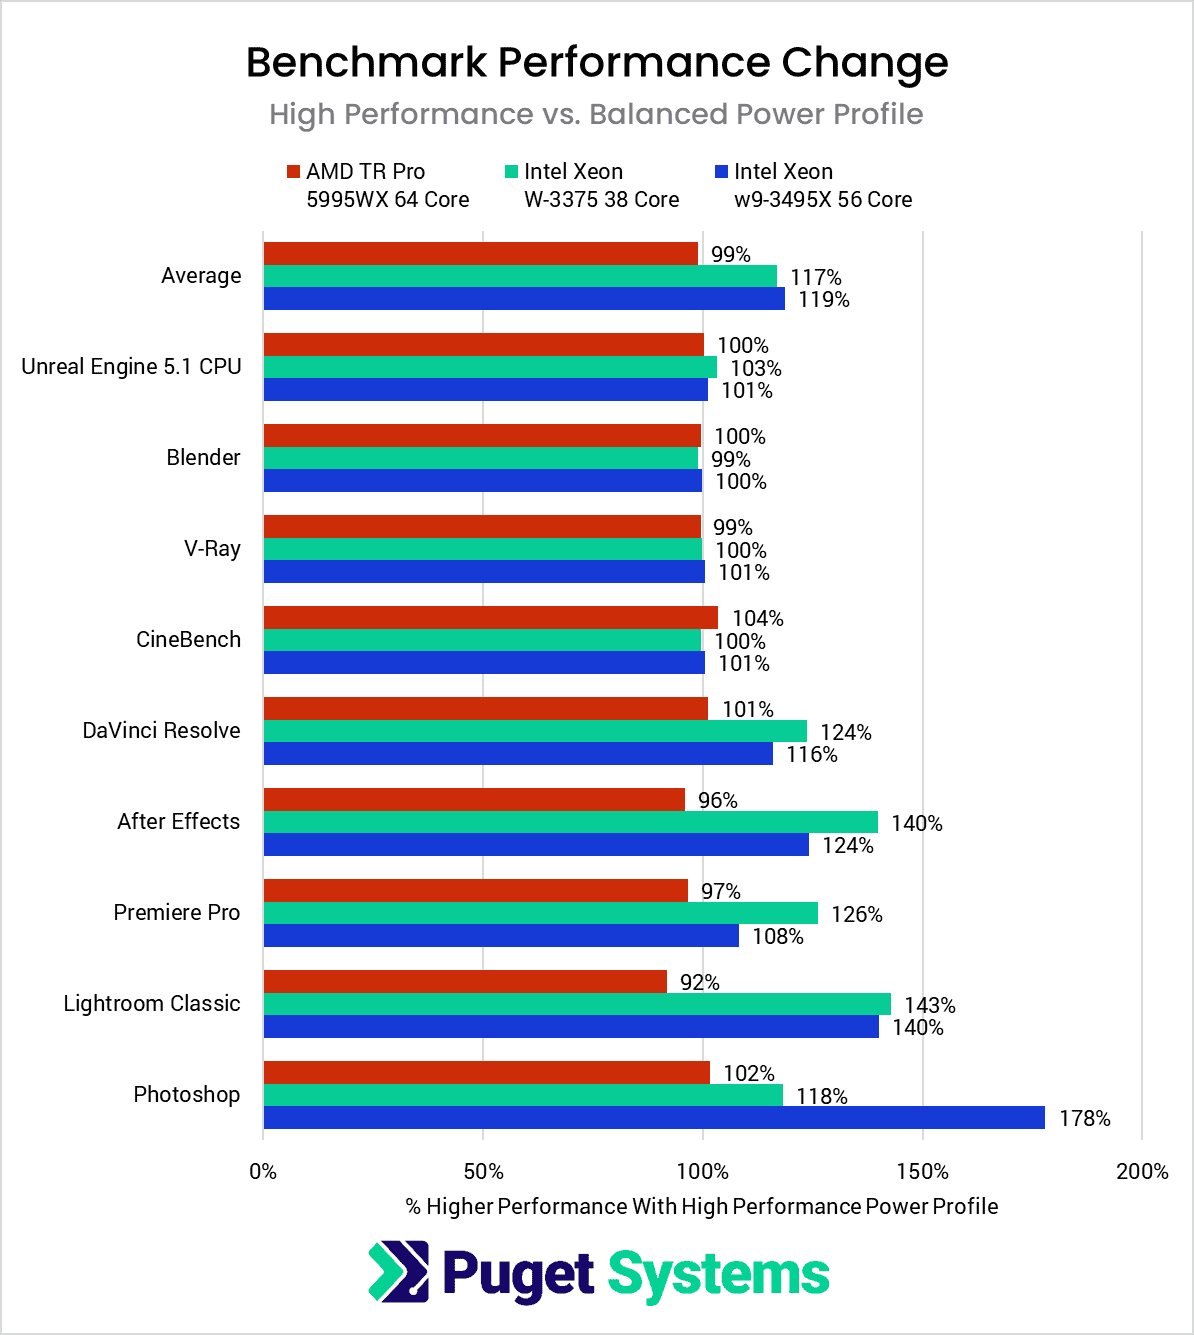
The chart above shows how much faster the system is when using the High Performance power profile rather than the default Balanced profile. Anything above 100% indicates a performance increase with the change in power profile, while anything below 100% means there was actually a performance drop. In most cases, anything between 95-105% can be considered to be within the margin of error, and thus effectively unchanged.
On average, we saw about a 20% increase in performance on the new Intel Xeon w9-3495X when we switched to the High Performance power profile. That is about on par with the previous generation, though oddly much less than we saw with the new Xeon W-2400 processors, and solidifies the fact that you want to use the High Performance profile with these Xeon CPUs.
If we drill down by benchmark, you will notice that the more lightly threaded the application is, the bigger the difference you should see from changing the power profile. It usually makes little difference for things like CPU rendering, but it increases performance by a massive 78% in applications like Photoshop.
However, changing the power profile has a downside in that it increases the power draw of the CPU while idle and under light loads. We found that the w9-3495X pulled about 86 watts at idle with the Balanced power profile, but 167 watts with High Performance – nearly a 2x increase in CPU power draw! For reference, the Threadripper PRO 5995WX only pulled about 50 watts at idle with either power profile, making it 3x more efficient when idle.
CPU Power Consumption and Temperatures
Recently, we have been running HWiNFO alongside our benchmarks to track things like power draw and temperatures. Our main goal for doing this is twofold:
- To be able to see if one CPU consumes significantly more or less power than another (especially when the performance is similar)
- To ensure that we are not in danger of hitting any thermal throttling limits
We could also use the temperature logs to rank each CPU in terms of heat and noise, but one issue we have encountered is that different motherboards use different fan profiles, which can greatly impact the CPU temperature. We could alleviate this issue by running the CPU fans at 100%, but then the temperatures would not be what most end-users would see in reality.
Because of this, for the CPU temperatures, we are (for now) going to use them to solely make sure we are not running into any cooling limitations. We have some thoughts on how to improve this in the future so we can include thermal comparisons, but it will require a bit more work on our part.
With all that said, let’s take a look at how much power these new CPUs use, then we will examine the CPU core temperature:
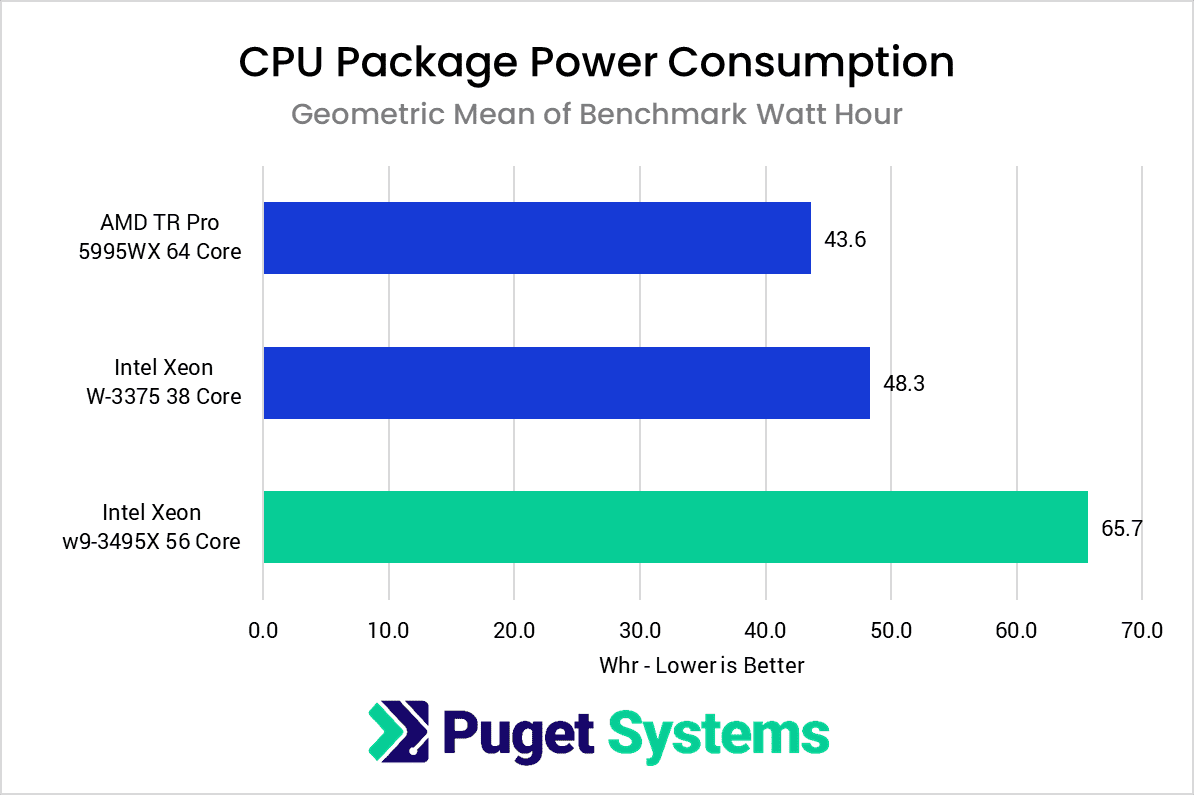
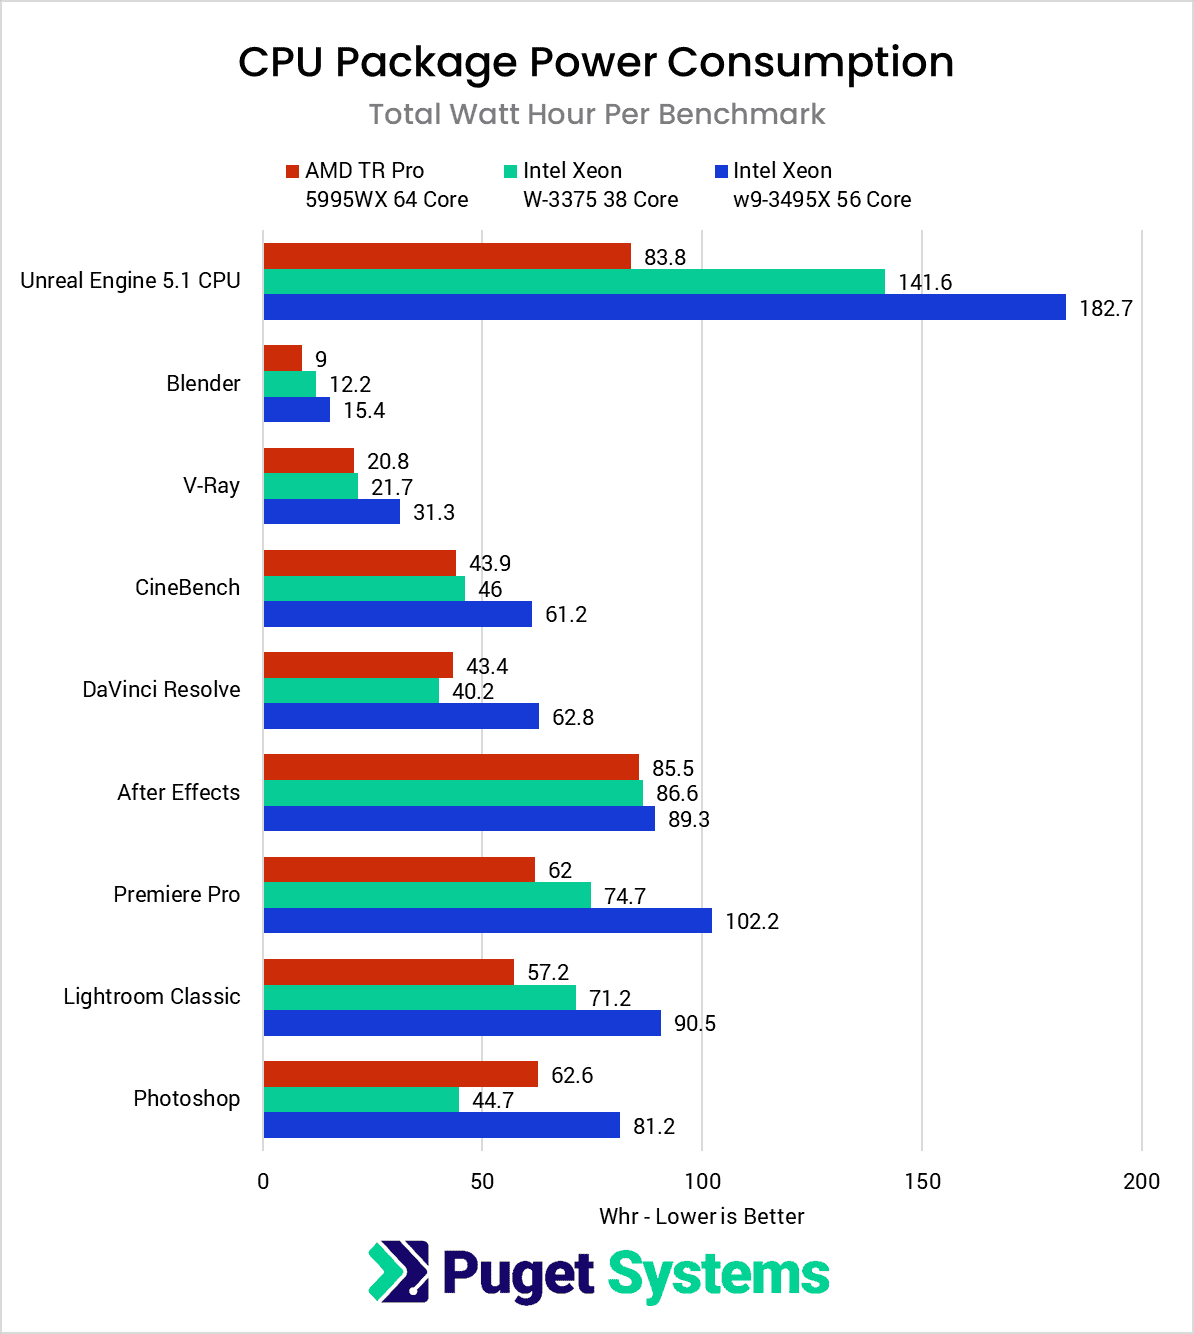
We opted to parse our power consumption data in two ways: the geometric mean of all benchmarks, and individually by benchmark. The geomean consumption tells most of the story, with the new Intel Xeon w9-3495X using about 50% more power overall compared to the AMD Threadripper PRO 5995WX. It also uses more power than the previous generation Xeon W-3375, but that is comparing a 38-core CPU to a 56-core, so not a fair comparison.
Feel free to switch to the second chart if you want to see the total power consumption broken down by application, although that information is more useful to look at in conjunction with the performance charts later in this post. Lower power draw is great, but if the CPU doesn’t also give performance that is on par or better, it may not be worth it.
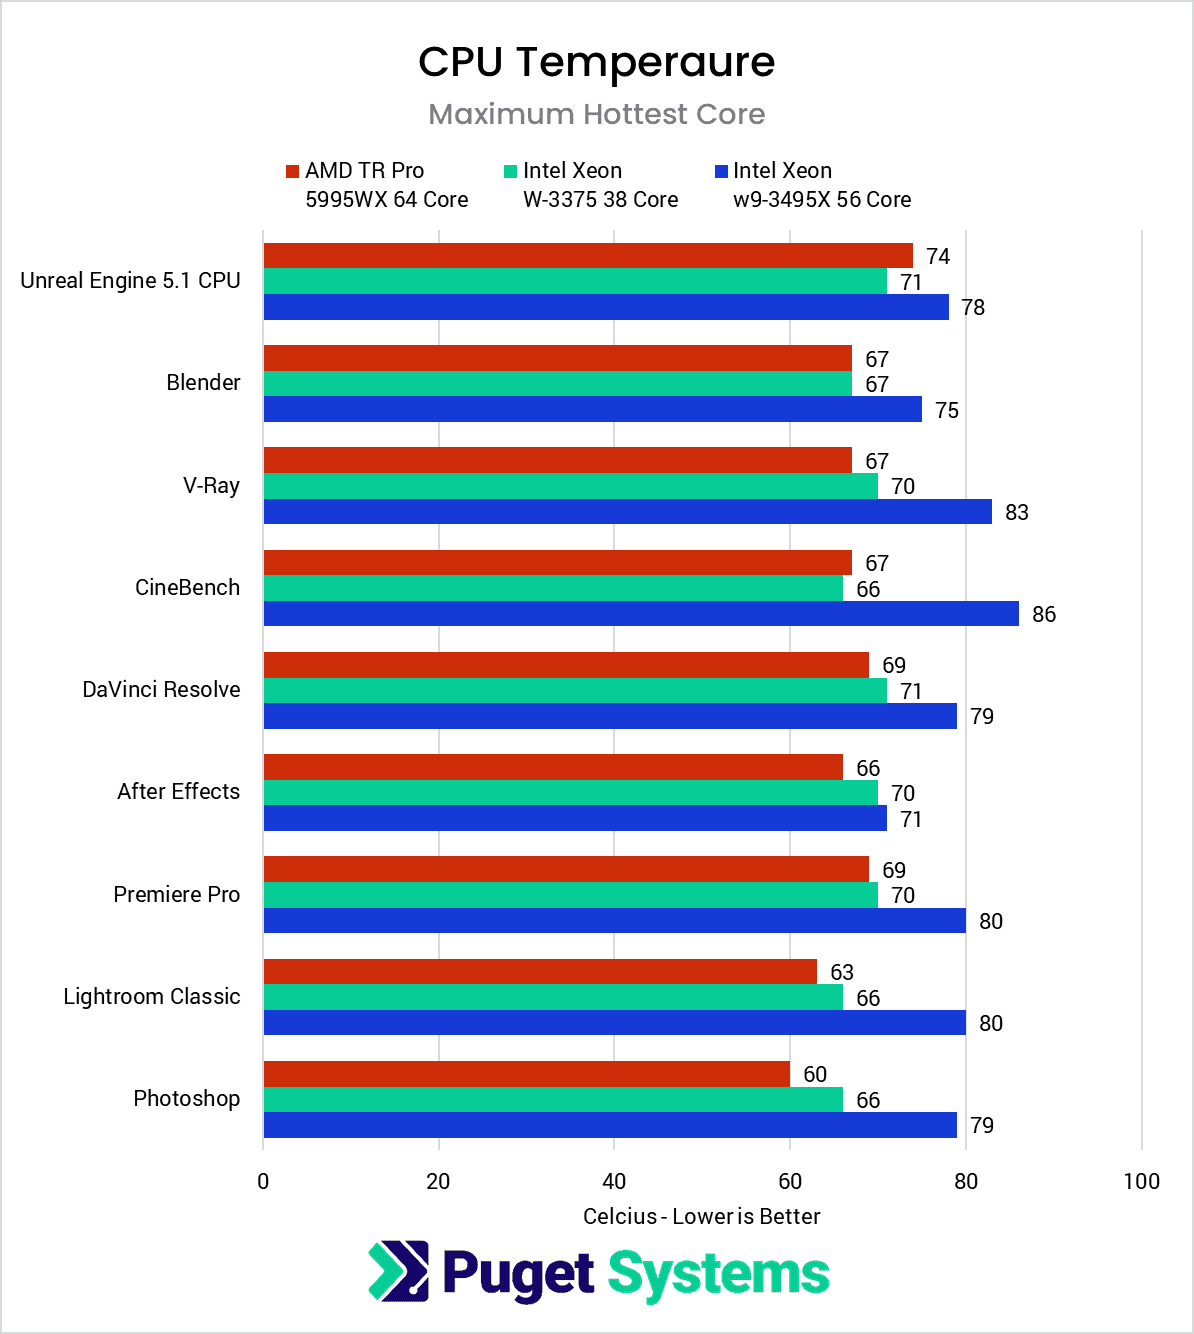
As stated earlier in this section, we are logging CPU temperatures to ensure that we are not close to any thermal throttle limits. Because that is our primary concern, we isolated the maximum temperature from the hottest CPU core during each benchmark.
The CPU core temperature on the new Xeon processors is definitely much higher than Threadripper PRO or the previous generation Xeon, which makes sense given how much more power they are using. Fan ramping is likely coming into play somewhat here, but this is plenty to give us confidence that we don’t have to worry about thermal throttling being a factor, even under the heaviest loads. We need to stay under 94C on the Xeons and 95C on Threadripper PRO to avoid throttling, which we are well below. If you want to overclock these CPUs, a Noctual 140mm air cooler may not be enough – but for our purposes, it works great.
Video Editing: DaVinci Resolve Studio
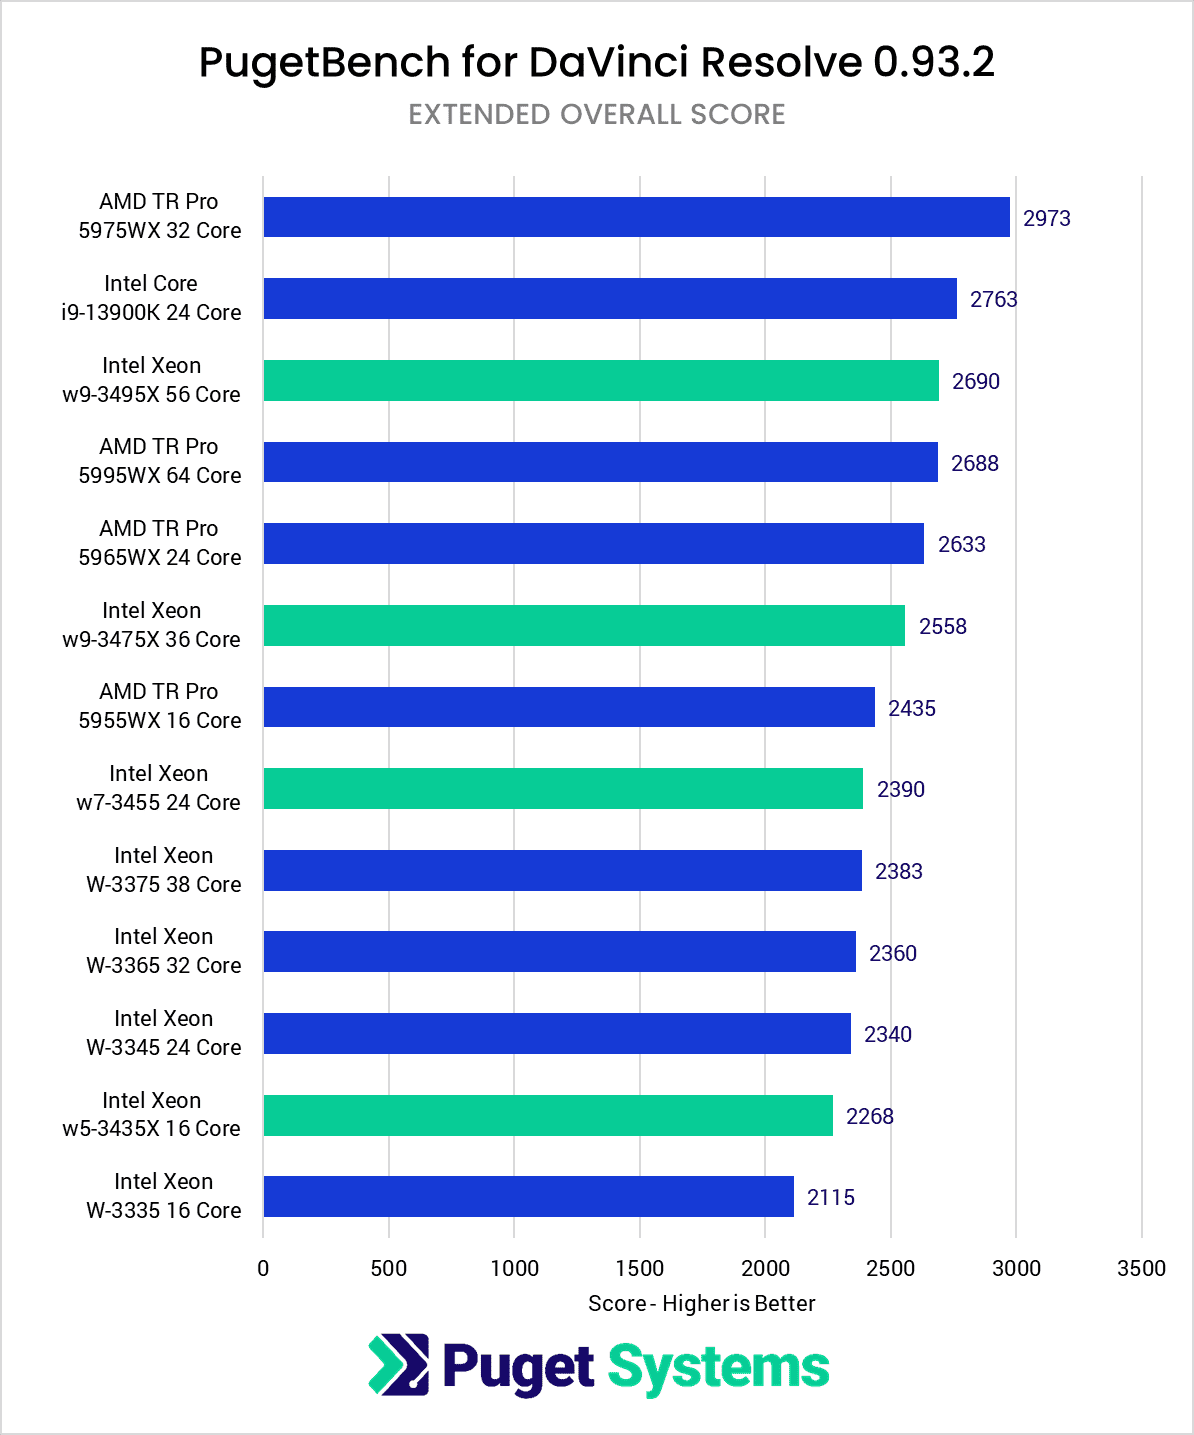
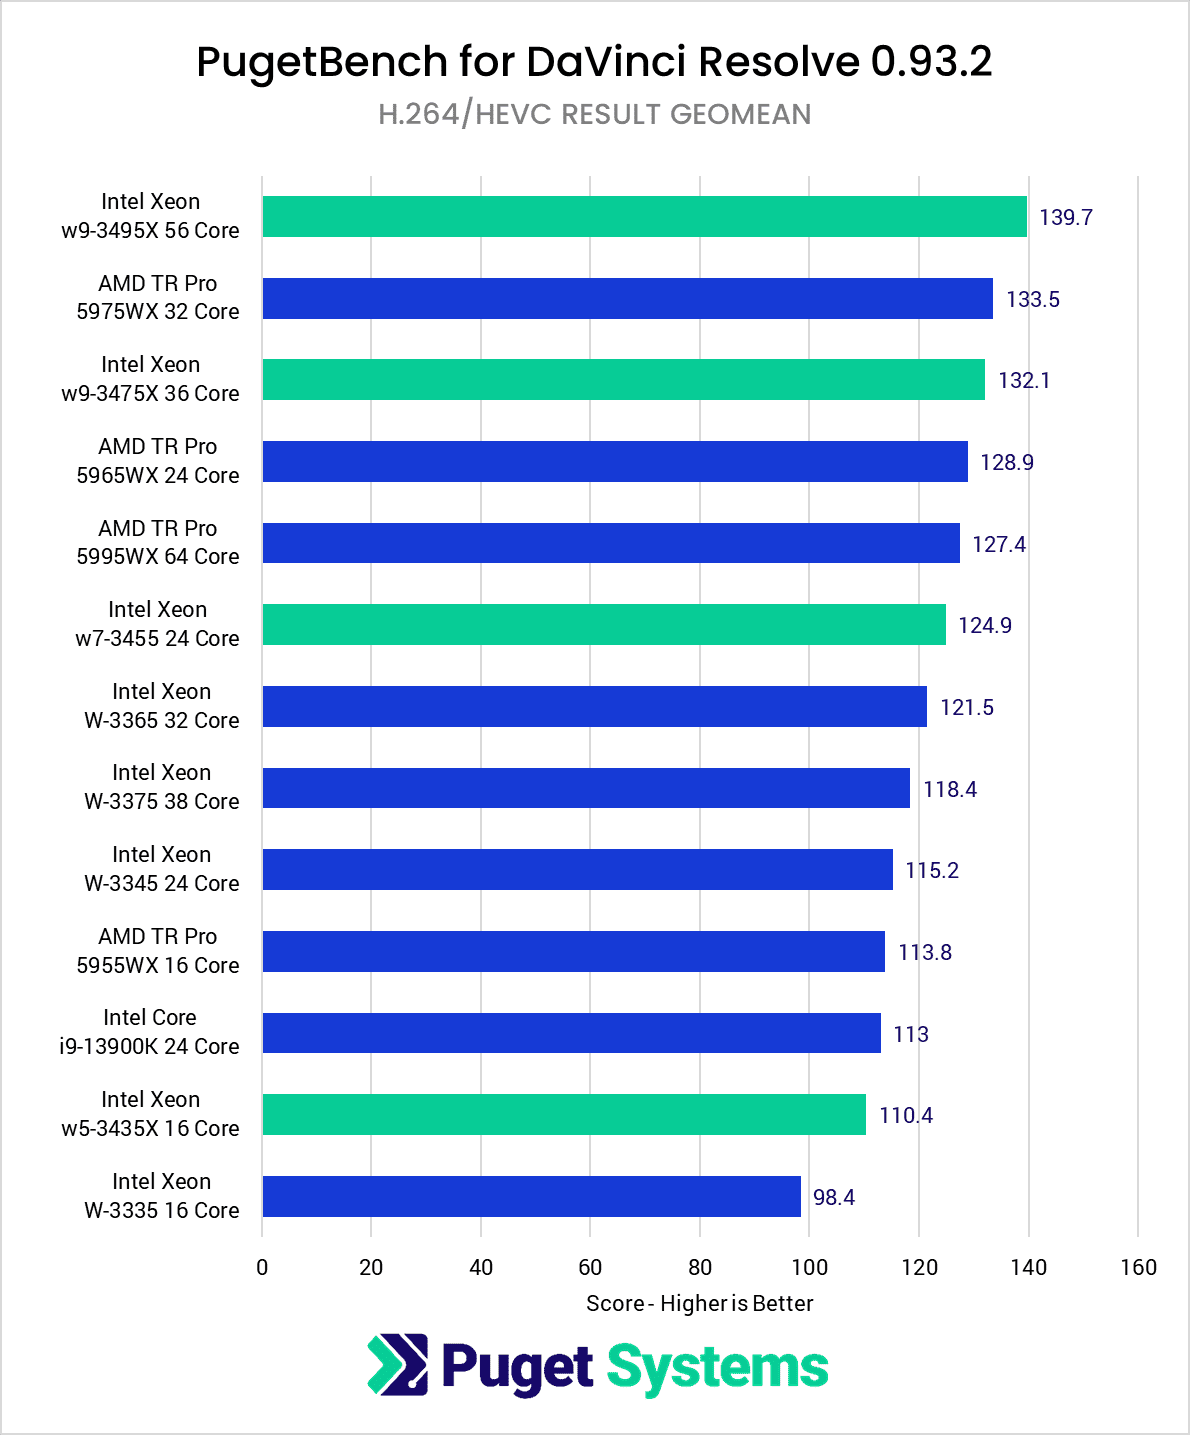
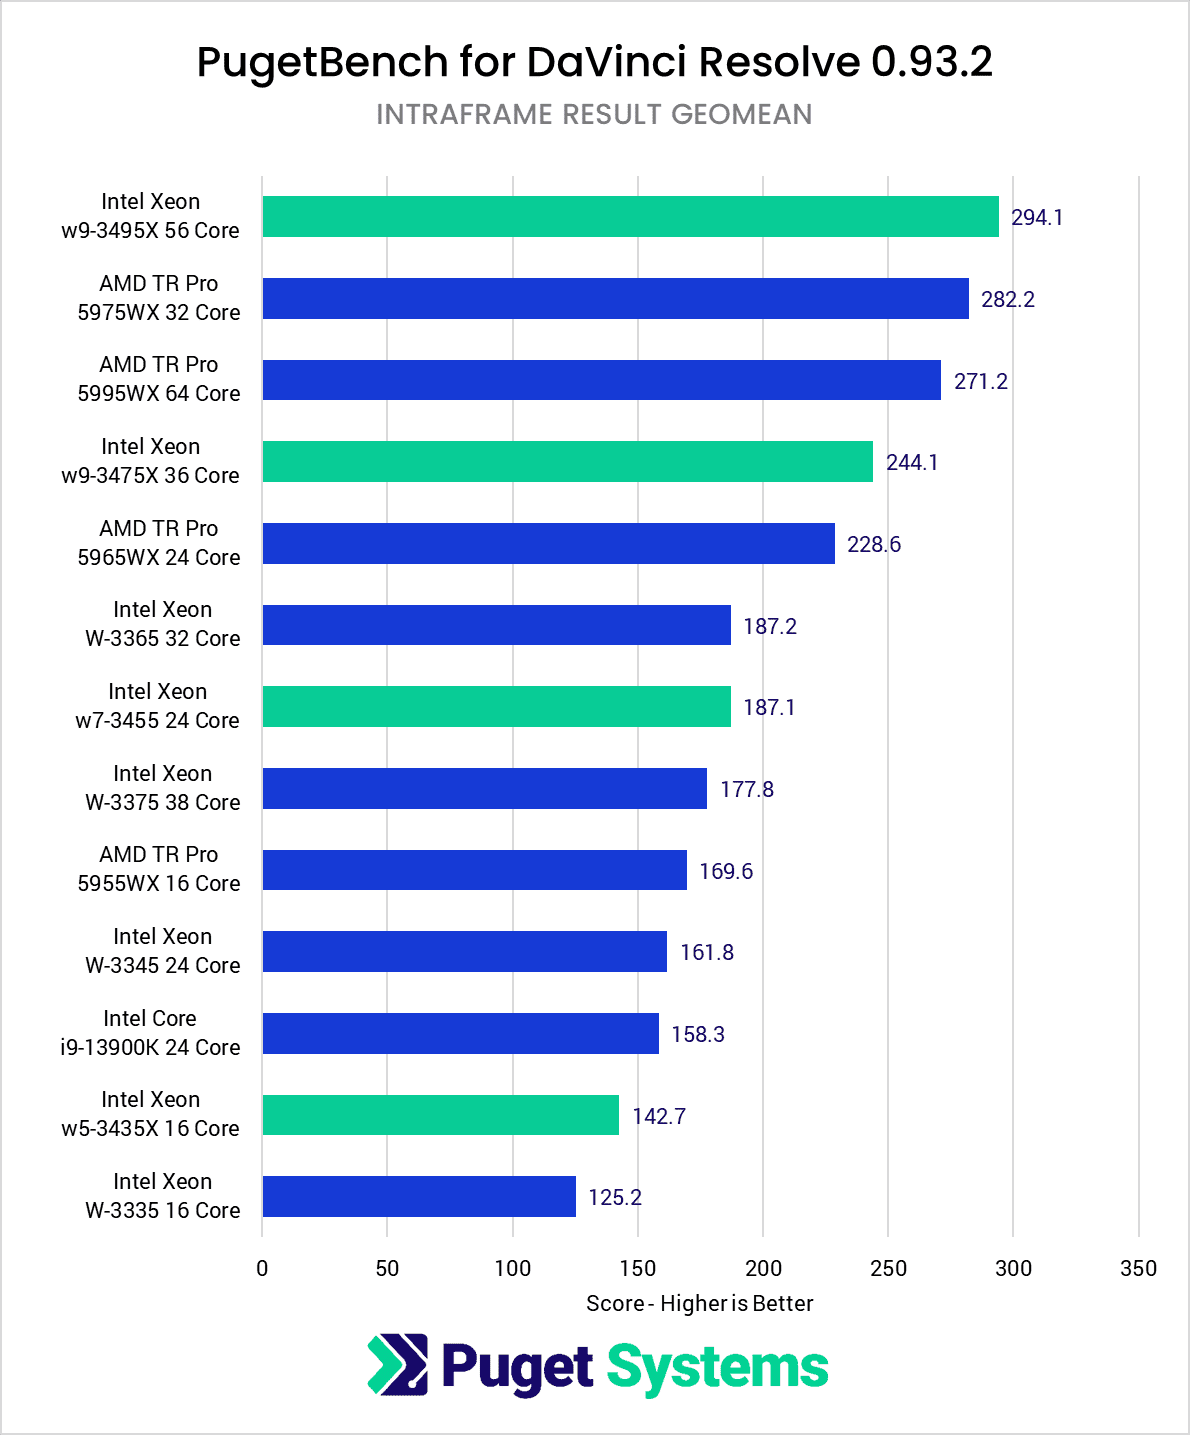
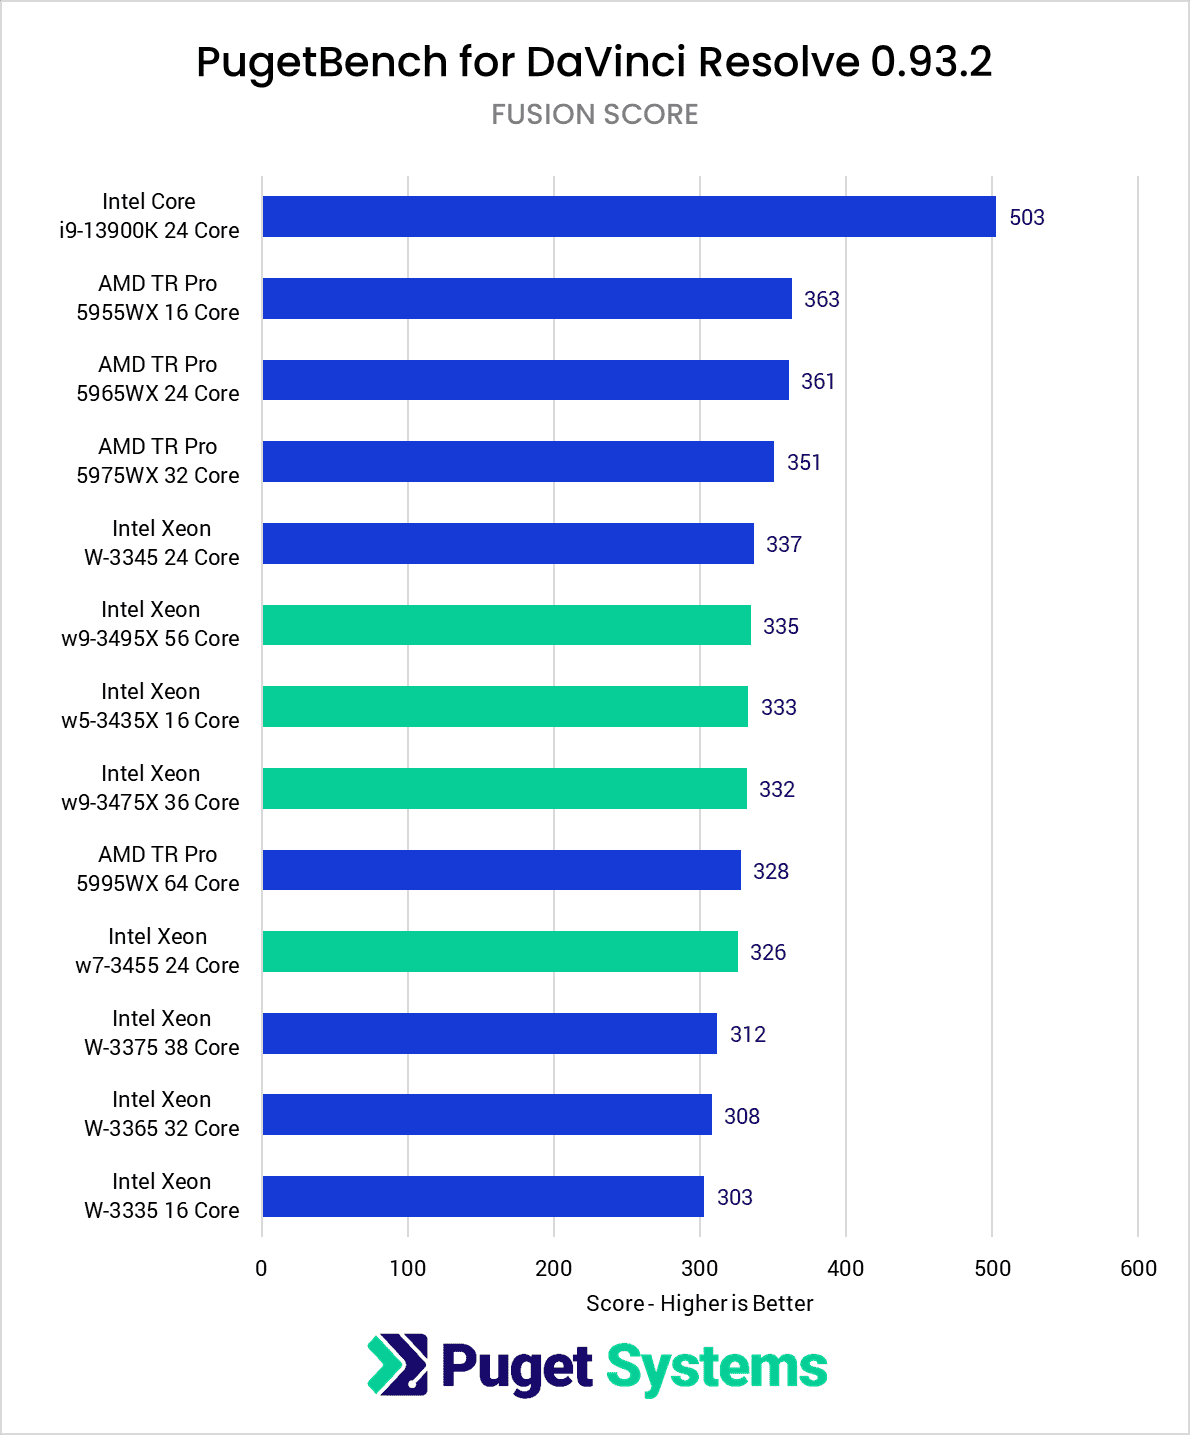
To start off our performance analysis, we are looking at one of our more complicated benchmarks: DaVinci Resolve Studio. Many of our benchmarks include an “Overall Score” and various sub-scores for different workflows, and those sub-scores can sometimes tell a very different story. Because of this, we will actively call out where there are interesting results beyond just the Overall Score.
Compared to the previous generation Intel Xeon W-3300 processors, the new W-3400 CPUs are slightly faster, but nothing groundbreaking. The w5-3435X 16 Core is 7% faster than the W-3335, while the w7-3455 24 Core is only a few percent faster than the W-3345. At the very top-end, the w9-3495X 56-Core is about 16% faster overall than the Xeon W-3375 38-Core.
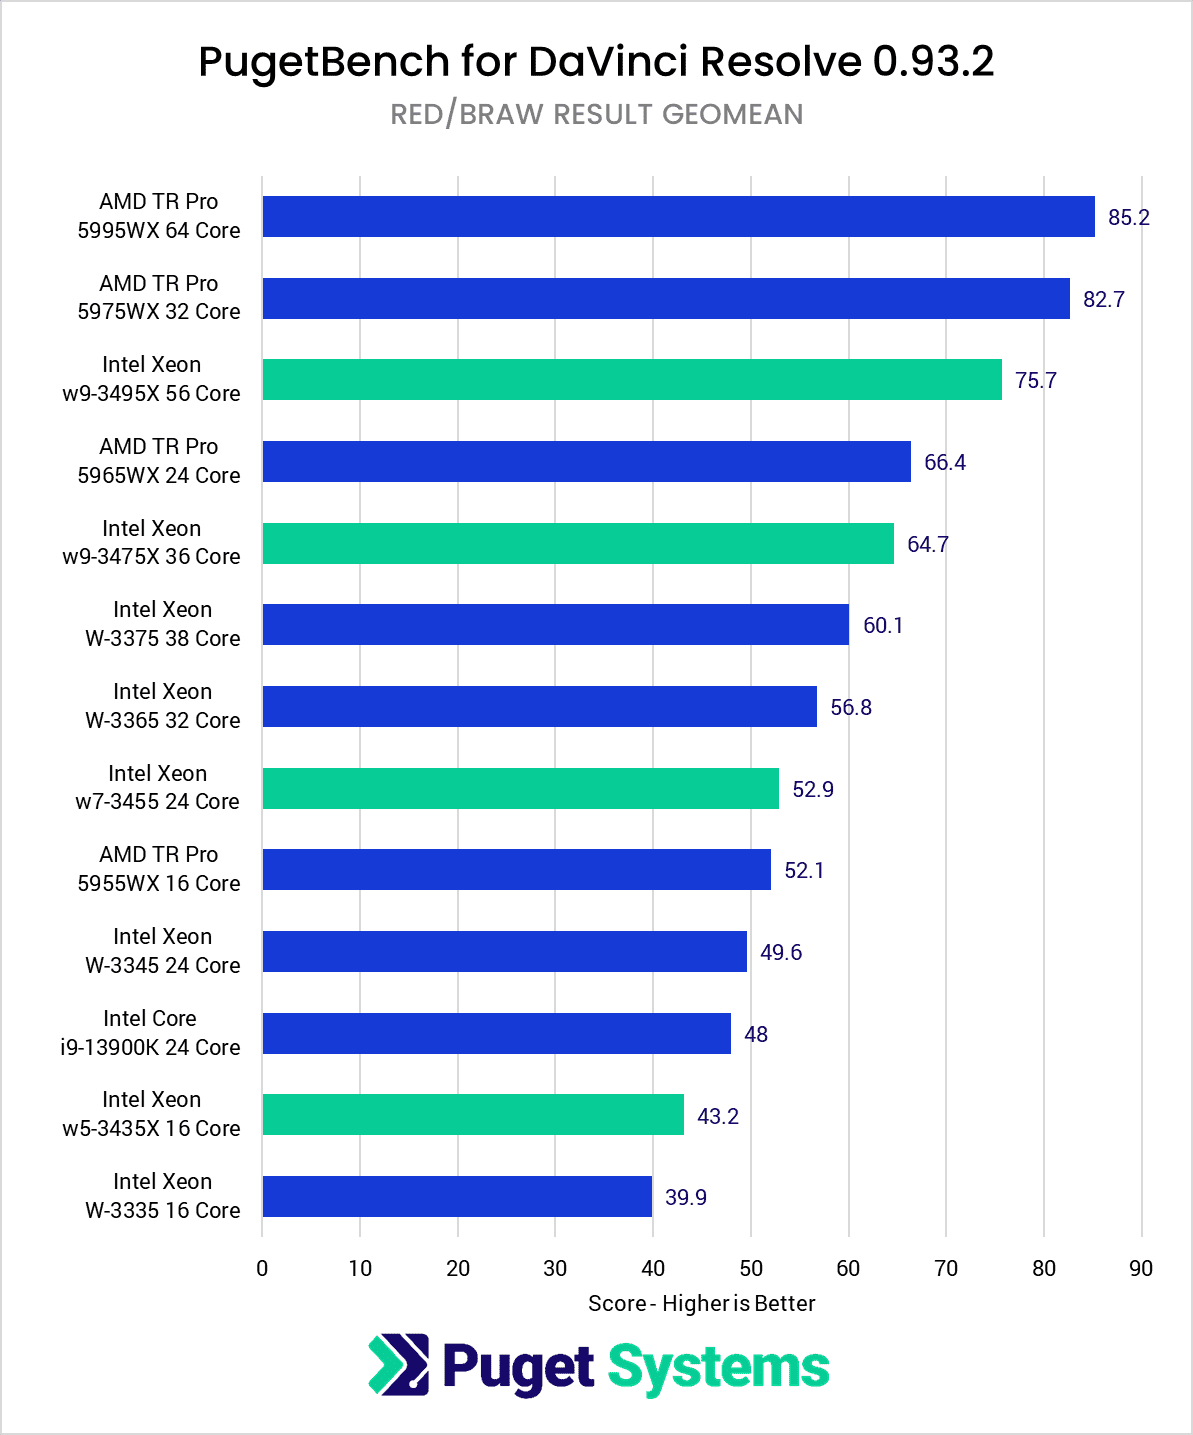
The good news is that the performance gain is quite a bit higher if we focus on RAW codecs (chart #2). This is the type of workflow where this class of CPU is used most often, and the new Xeons are anywhere from 7% faster at the lower core counts to 26% faster with the top-end w9-3495X.
However, even with these performance gains, it isn’t quite enough for Intel to catch up to AMD. In terms of overall performance, AMD still manages to hold a relatively modest 7-16% lead. Technically, the w9-3495X is on par with the TR PRO 5995WX 64 Core, although since the TR PRO 5975WX 32-Core is a bit faster than the 64-Core model, that is a bit of a hollow victory.
Our big concern for Intel is how much faster AMD is for the RED/BRAW codecs (chart #2 again). While the new Xeons are faster than the previous generation, AMD is so far ahead that, even with the performance gains, the Threadripper PRO CPUs are 13-28% faster than their new Xeon counterparts for these codecs. And, even worse for Intel, the Xeon W-3400 CPUs use about 45% more total power to complete the same benchmark. In other words, for Resolve, AMD TR PRO 5000 WX is both faster and uses less power than the Intel Xeon W-3400 CPUs.
Video Editing: Adobe Premiere Pro
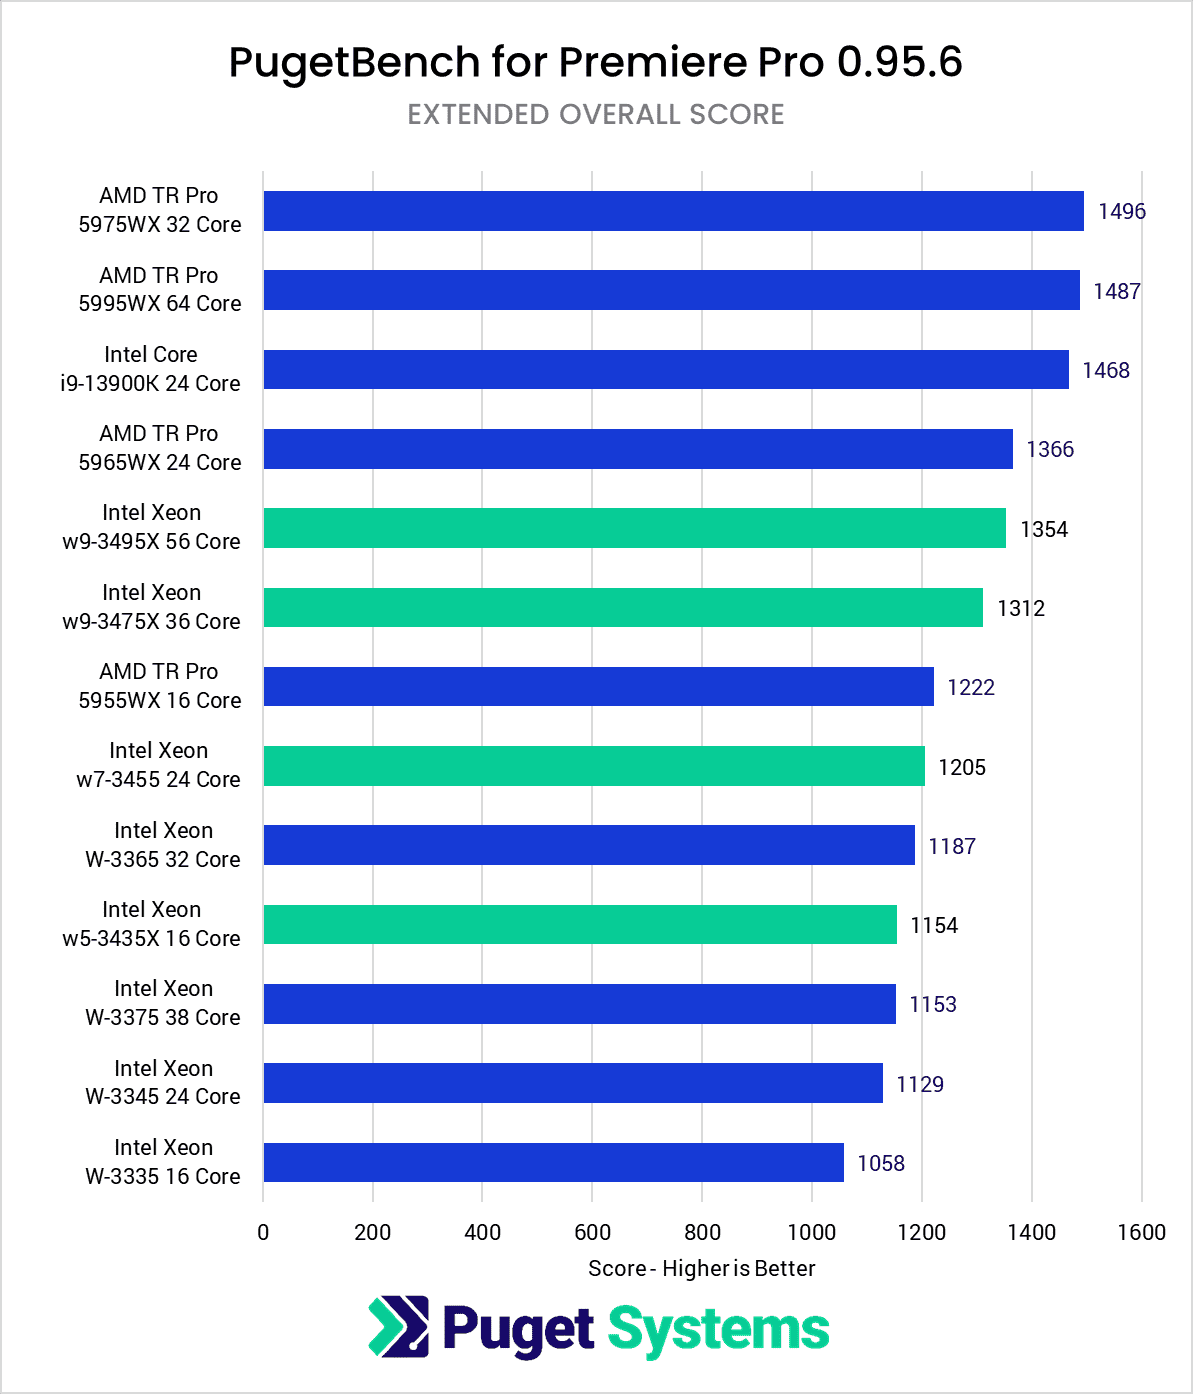
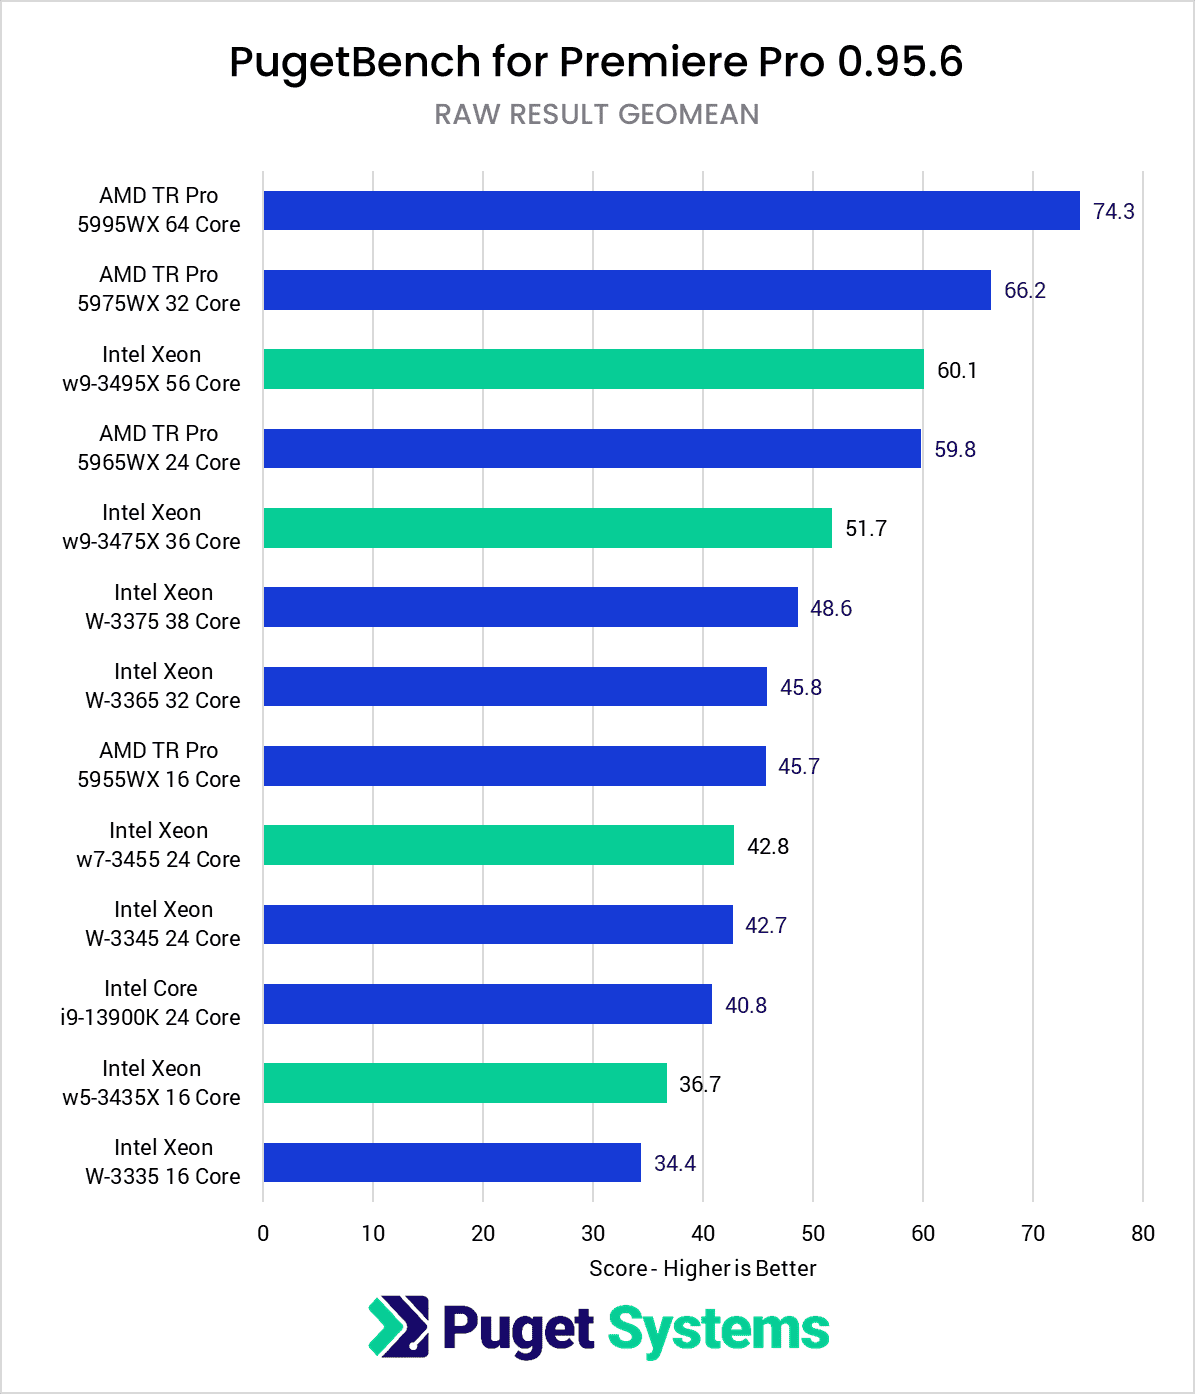
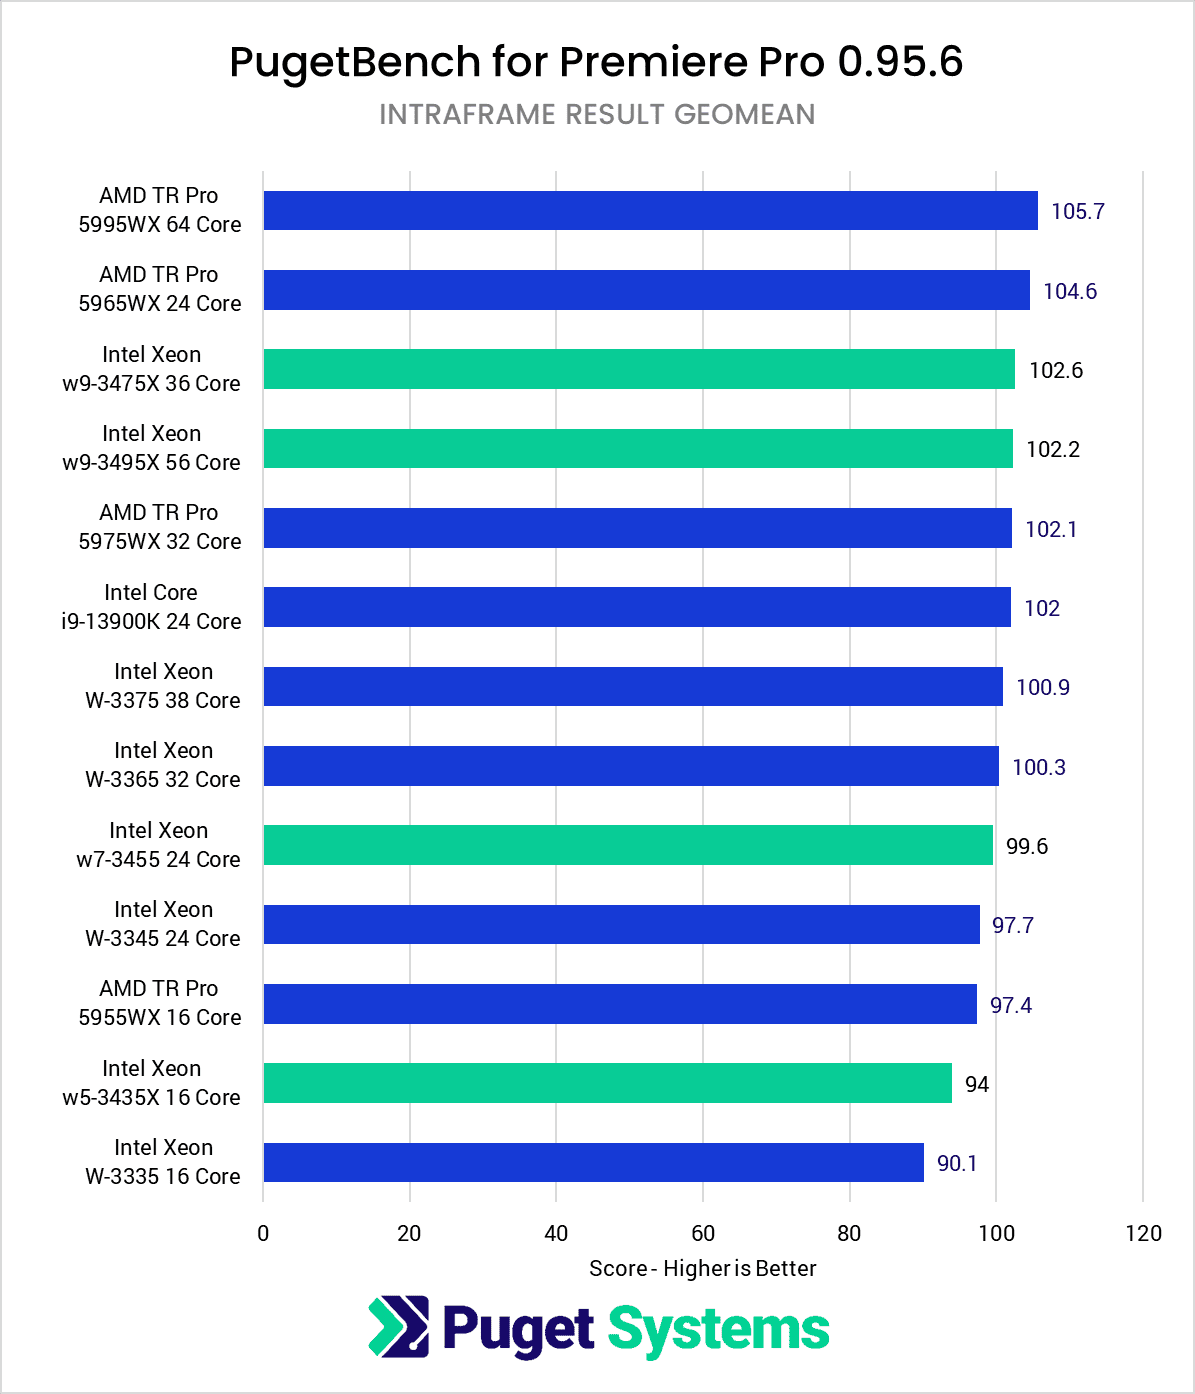
Adobe Premiere Pro is very similar to DaVinci Resolve Studio, with the new Xeon W-3400 CPUs performing about 10% faster than the previous generation. This is a fairly modest gen-over-gen improvement and not enough for Intel to catch up with AMD. In terms of overall performance, AMD Threadripper PRO is still about 6-14% faster than Intel.
A big part of this is due to Intel’s relatively poor performance with RAW codecs – which, again, is one of the main workflows where you might want to invest in a higher core count CPU. When working with this type of codec, the AMD Threadripper PRO CPUs are anywhere from 24% to a massive 40% faster than Intel.
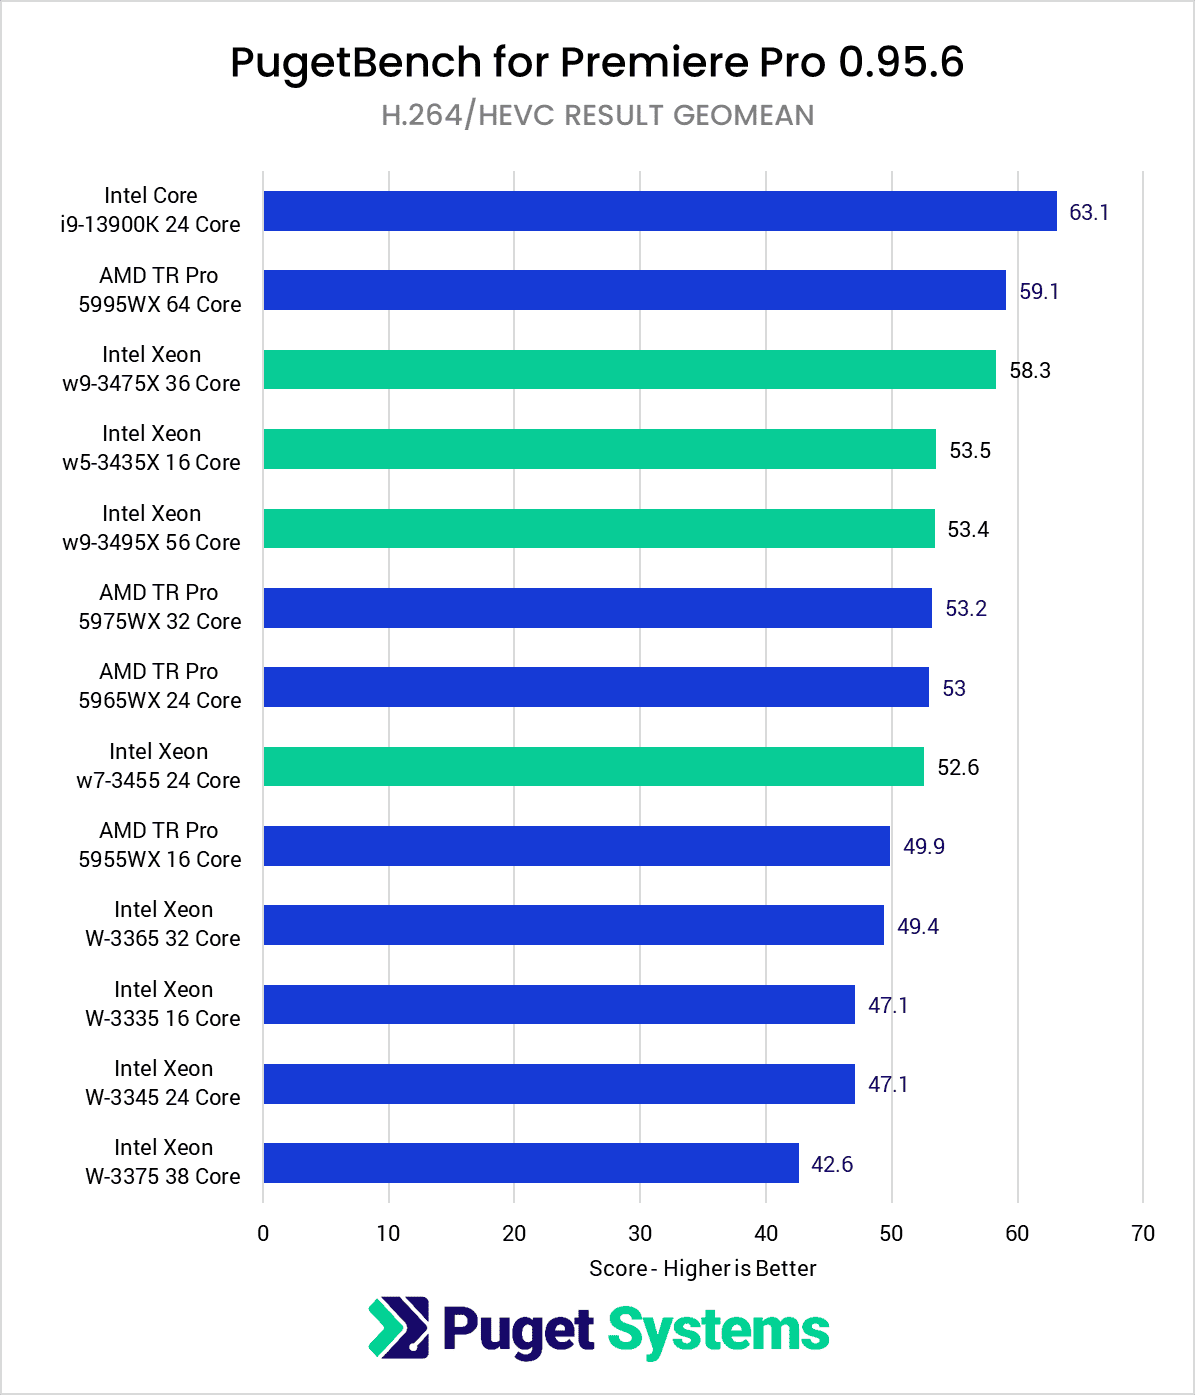
The new Xeons do, however, keep up just fine when working with intraframe codecs like ProRes, and in some cases, are up to 7% faster than AMD for long GOP codecs. Although, if long GOP codecs like H.264 and HEVC are a concern, we would recommend the Intel Core i9 13900K rather than the new Xeon W-3400 line. Not only is it a fraction of the price ($570 for the 13900K vs $2,489 for the w7-3445), but it is faster almost across the board. The Core i9 13900K also includes Intel Quick Sync, allowing you to use hardware decoding for a wider range of HEVC codecs than you can get from a discrete NVIDIA or AMD GPU.
Overall, the new Xeon W-3400 processors are very lackluster for Premiere Pro. In almost every case, AMD Theadripper PRO is faster (and at much lower power draw). In the few cases where these Xeons are decent, other Intel CPUs like the Core i9 13900K are an even better fit.
Motion Graphics: After Effects
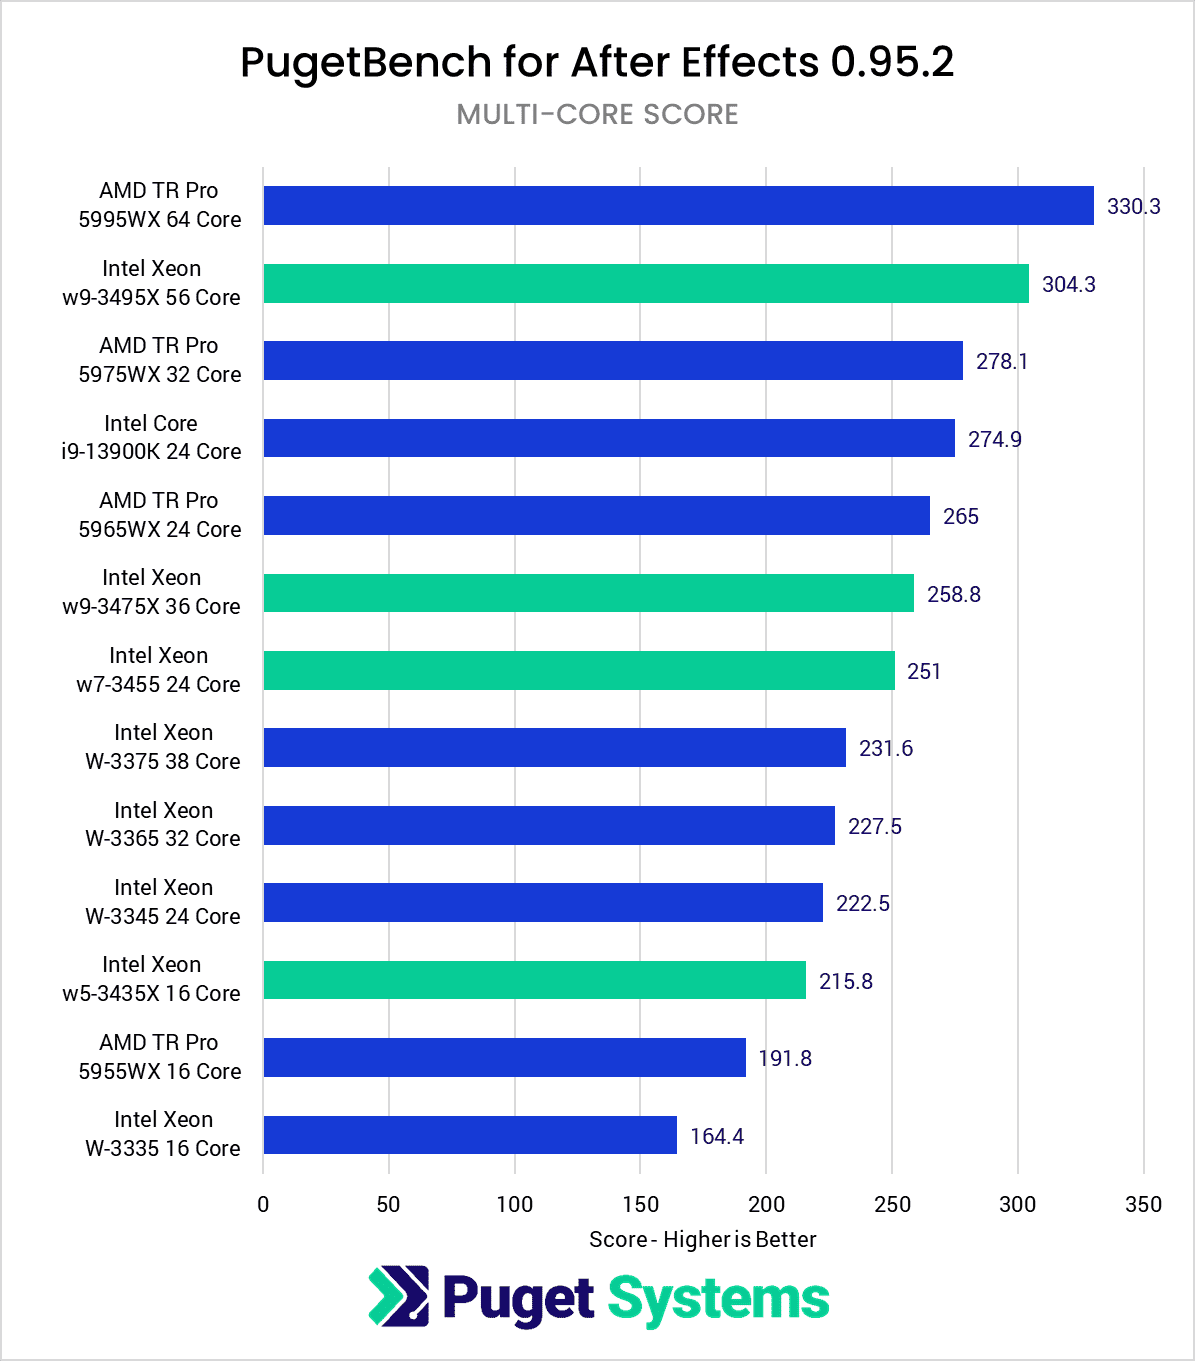
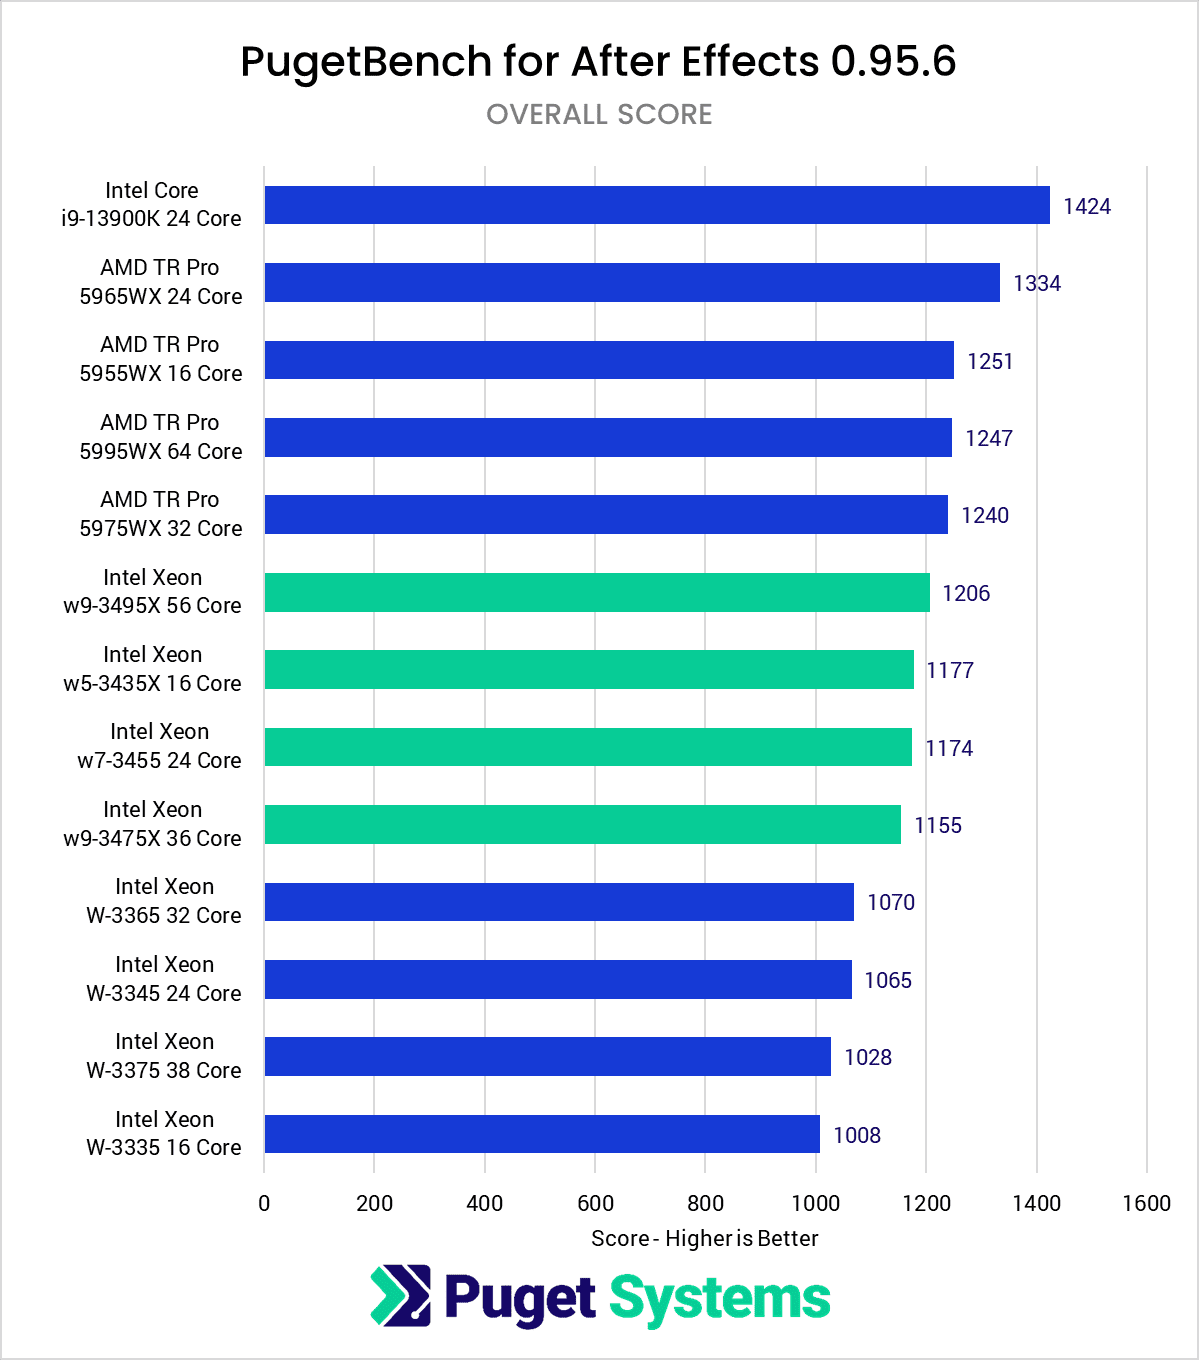
Adobe After Effects is always interesting to examine as there are two distinct workflows that often dictate what type of CPU you should get (Core/Ryzen or Xeon/Threadripper Pro). The majority of users will be better served by a CPU like the Intel Core i9 13900K since, in most situations, it is much faster than any of the Xeon or Threadripper PRO CPUs we tested. However, Intel Core (and AMD Ryzen) processors have a limited RAM capacity of 128GB, which isn’t enough for high-end workflows with long, complex compositions. In addition, those same projects tend to benefit most from the Multi-Frame Rendering (MFR) feature in After Effects, which works best on higher core count CPUs.
Since the main time you might invest in one of these Xeon CPUs is for heavier After Effects projects, we are going to focus on the Multi-Core Score from our benchmark. Feel free to switch to chart #2 if you want to see how these CPUs compare in simpler After Effects projects.
Compared to the previous generation, the new Intel Xeon W-3400 processors are much faster, showing between a 15% and 30% increase in performance. The benefit is larger at the lower core counts, with the w5-3435X 16-Core showing a 31% gain over the W-3335. The top-end w9-3495X 56-Core saw a similar gain over the W-3375 38-Core, although that isn’t a completely fair comparison due to how many more cores the 3495X has compared to the previous generation.
Compared to AMD, this gives Intel one of their first solid wins, with the w5-3435X 16 Core outperforming the AMD Threadripper PRO 5955WX 16 Core by about 10%. However, that is the only win for Intel: for all the other CPU models, AMD maintains a small 6-9% performance edge. And, it is only a win for the Xeon if you need more than 128GB of RAM, since the less expensive Intel Core i9 13900K is nearly 30% faster than the Xeon w5-3435X.
We do want to note that After Effects is one of the few workflows where the Xeon W-3400 CPUs don’t seem to consume significantly more power than Threadripper PRO. AMD holds a slim performance lead in most cases, but you could make arguments for using the new Xeon W-3400 CPUs in some situations.
Graphic Design: Photoshop
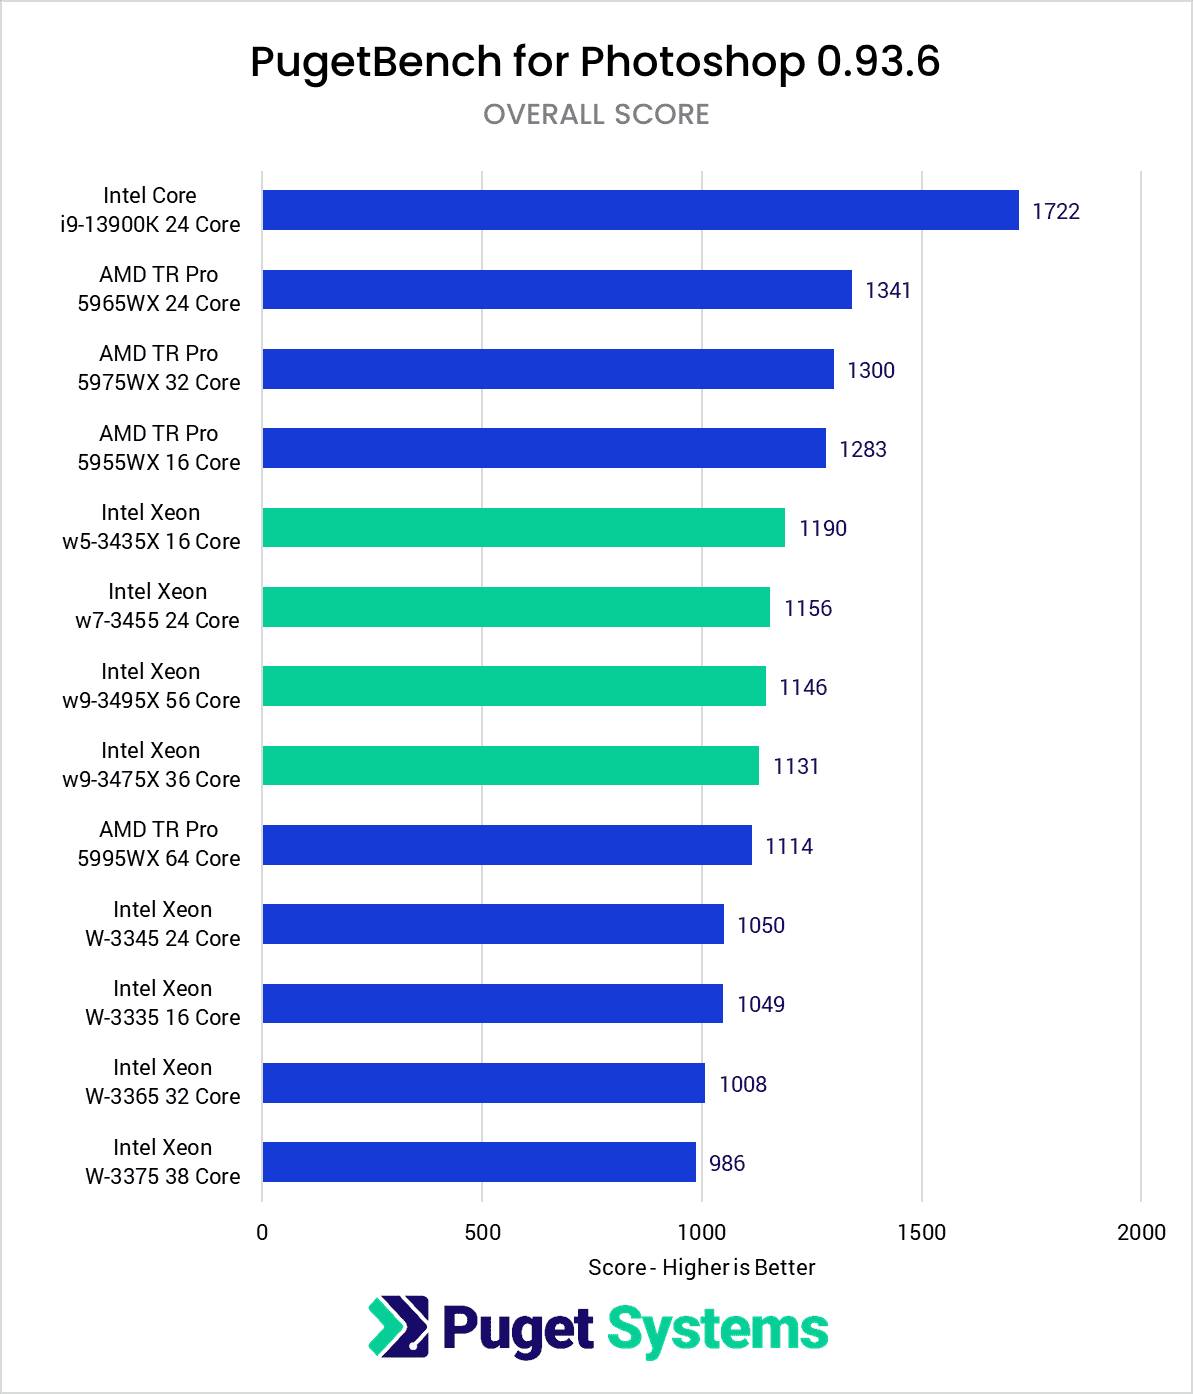
Photoshop is unlikely to be a primary application for anyone looking at this class of processor, but it is extremely common as a secondary app. The reason why few invest in Xeon or Threadripper PRO should be somewhat obvious from how much faster a CPU like the Intel Core i9 13900K is than any of the other CPUs we tested here. Outside of niche workflows that need more than 128GB of RAM, you can save a ton of money and get much higher performance with an Intel Core processor. Because of this, we often include Photoshop more to check for any major issues rather than determining which CPU is necessarily the fastest.
And in that sense, the new Xeons do just fine. They are a bit faster than the previous generation but still a bit behind their AMD counterparts. But again, this type of workflow is often simply a case of the performance being good enough more than anything else.
Photography: Lightroom Classic
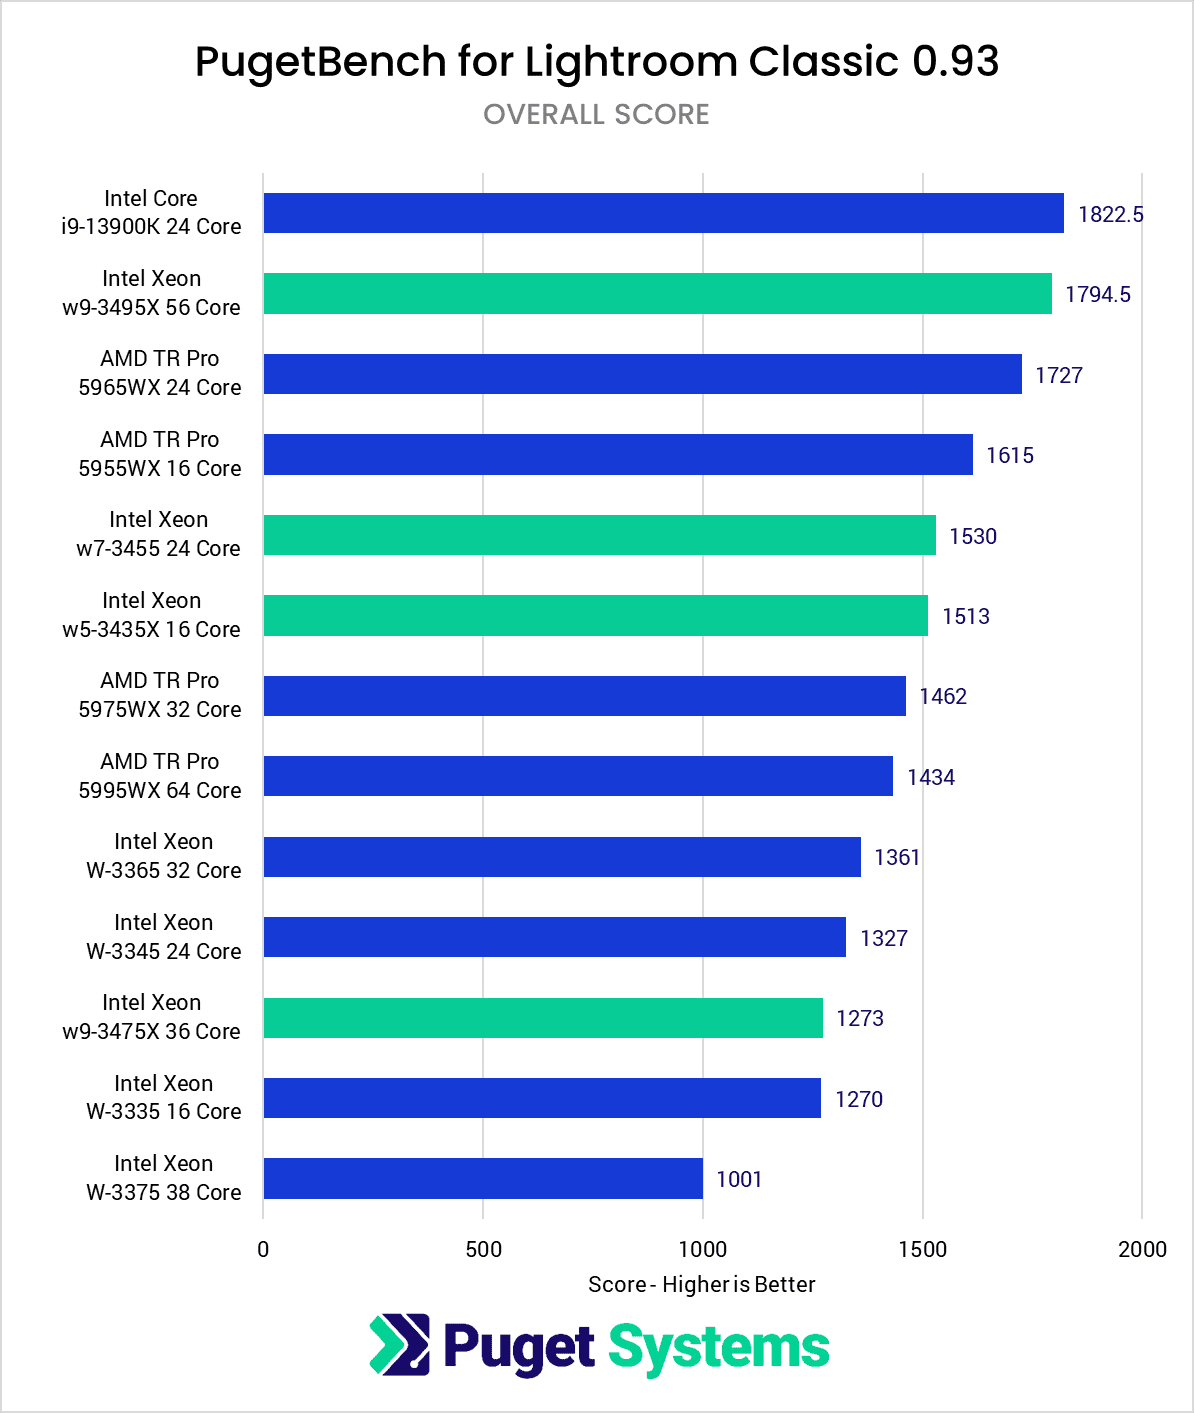
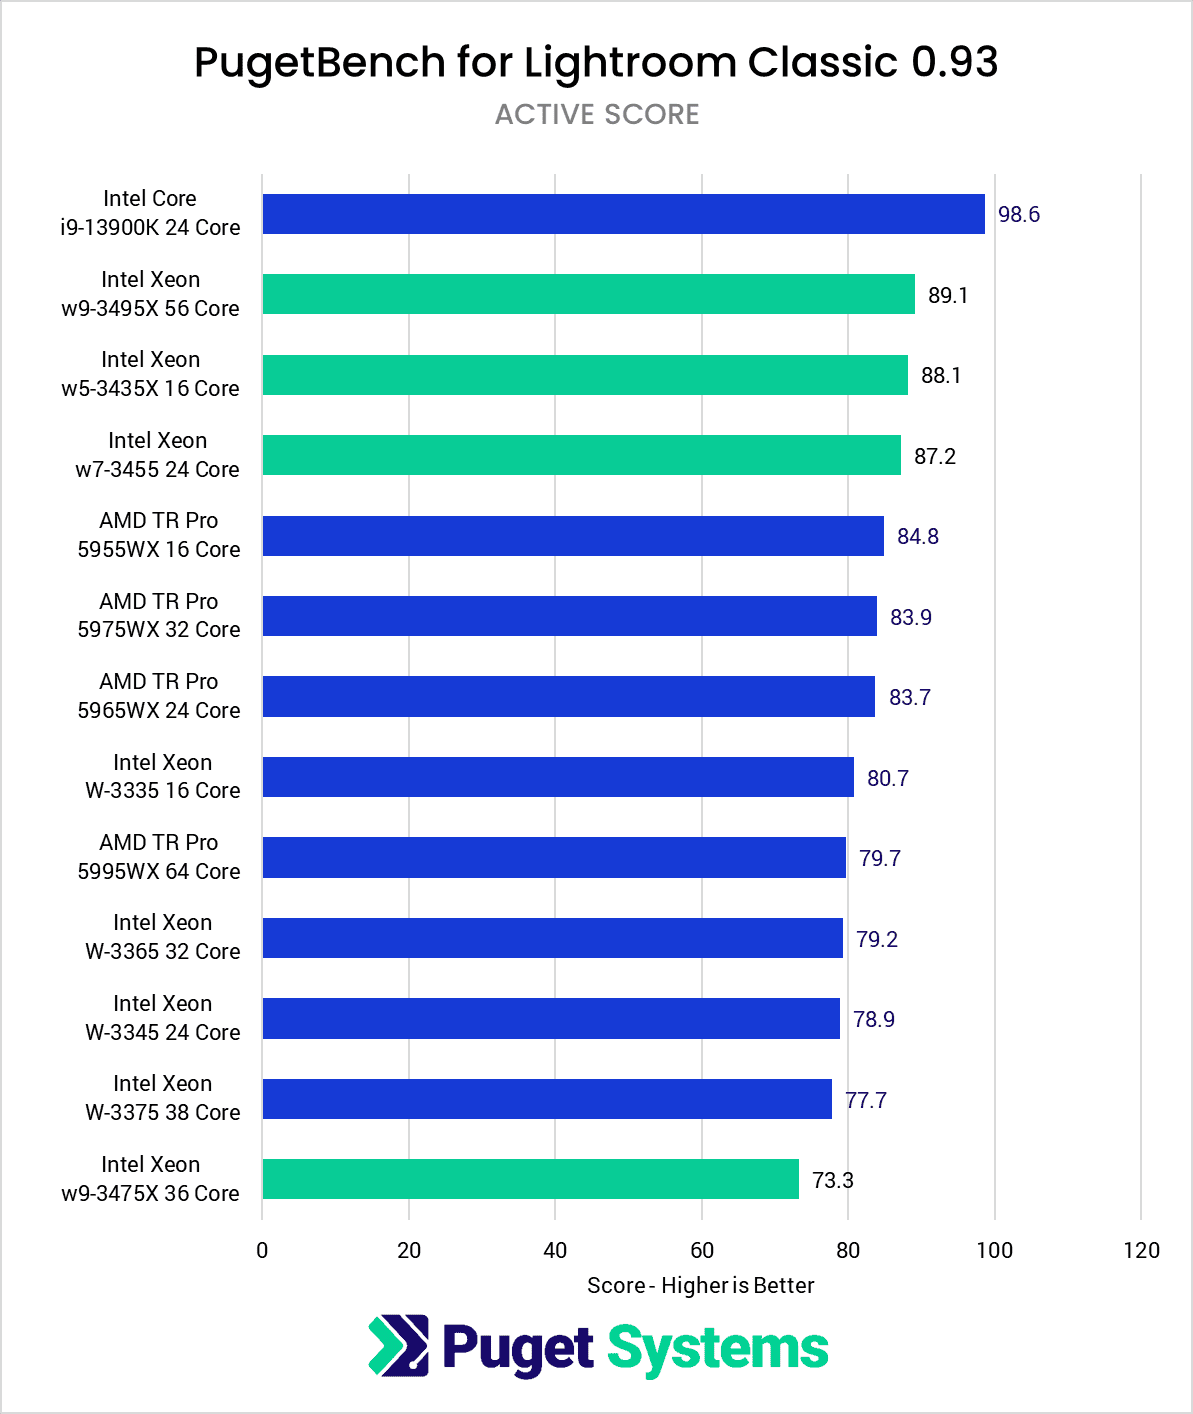
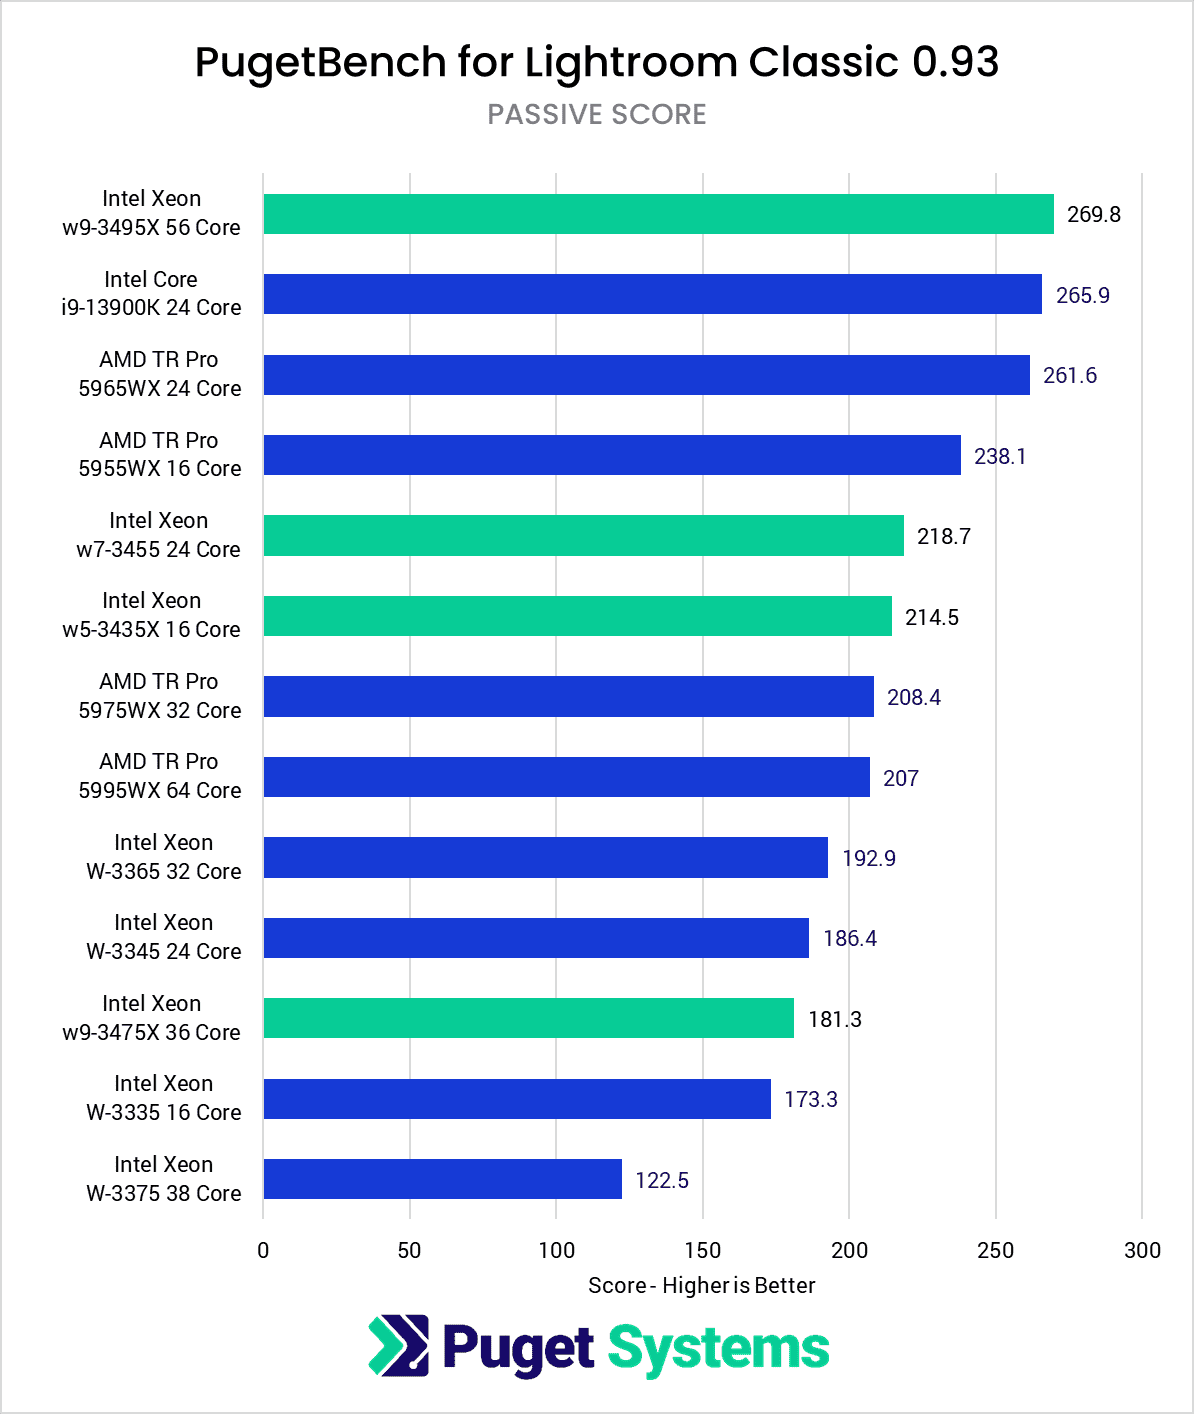
In recent years, we haven’t seen much use for either Intel Xeon or AMD Threadripper PRO processors for Lightroom Classic. In the past, this class of processor was able to give a good boost in performance for those working with thousands of photos at a time, but with how fast the Intel Core 13th Gen and AMD Ryzen 7000 CPUs are, that performance benefit has completely evaporated.
With the new Intel Xeon W-3400 processors, we see some very interesting mixed results. At the 16 and 24 Core level, the new Xeons are 15-20% faster than the previous generation, and the 56 Core w9-3495X is just a hair behind the Core i9 13900K. What is weird with Lightroom Classic is how poorly certain CPUs perform. A case in point is the w9-3475X 36 Core, or the previous generation W-3375 38 Core. Our primary theory for this is that Lightroom Classic is particularly poor at handling multiple logical processor groups, which is something Windows does when you have more than 64 threads, or 32 cores with hyperthreading. Windows has to divide the CPU into multiple groups, and treats each group similar to how it would if you had two physical CPUs in the system.
Unfortunately, the more “mismatched” those progressor groups are, the more likely you are to run into performance issues. AMD doesn’t have this issue as much since they jump from 32 cores (the limit for a single logical processor group) to 64 cores (exactly two groups). Intel, on the other hand, has certain models like the w7-3475X with 36 cores, which doesn’t evenly divide.
With all that said, the big takeaway is that neither AMD Threadripper PRO nor the new Intel Xeon W-3400 line can quite catch up to the Intel Core i9 13900K. Unlike After Effects, where it is fairly common to need Xeon or Threadripper for the additional RAM capacity, this isn’t the case in Lightroom Classic very often. In other words, while the new Xeons are (in most cases) a big improvement over the previous generation, the much more affordable Intel Core i9 13900K is going to be the better choice for 99% of Lightroom Classic users.
Game Dev/Virtual Production: Unreal Engine
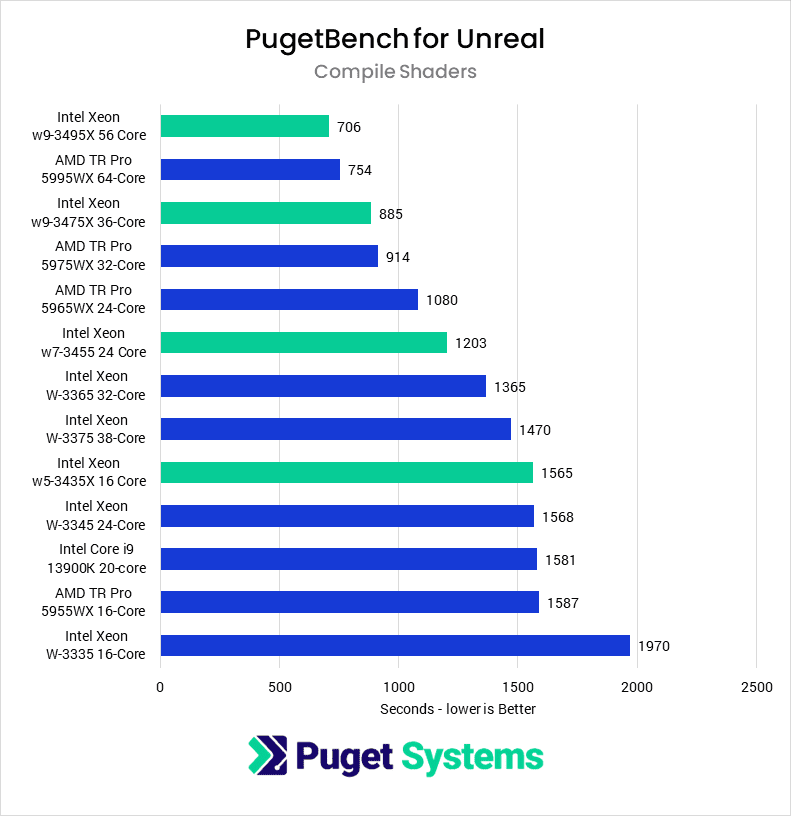
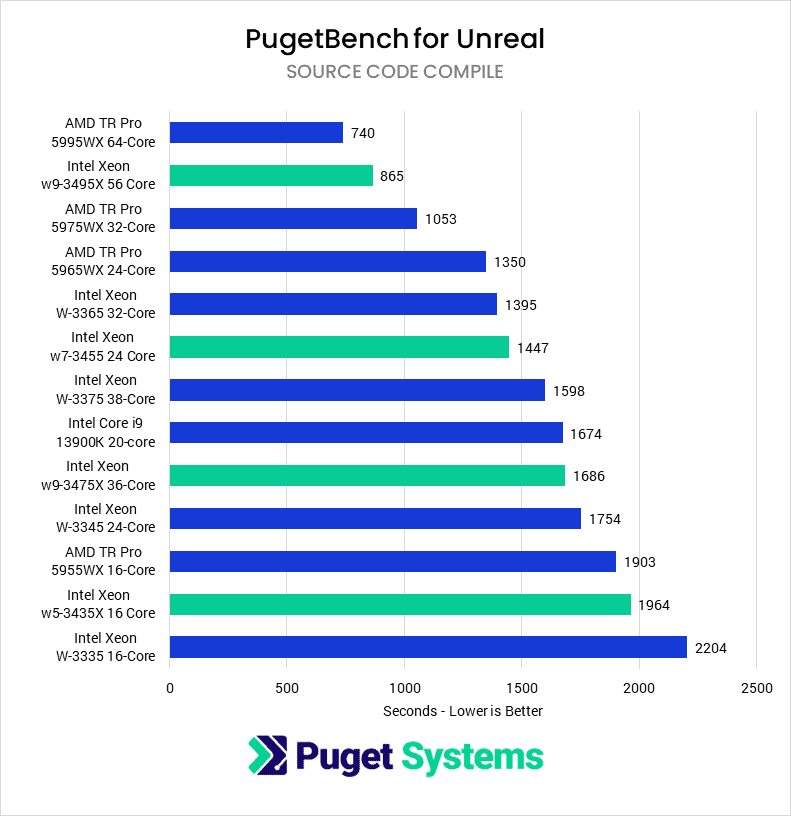
Unreal Engine has a very wide variety of users in different industries, and most of the heavy lifting in Unreal Engine is GPU bound. Regarding CPU-specific tasks, we look at shader compilation (which everyone experiences from time to time at the very least), light baking, and code compilation in Visual Studio. Light baking is quickly falling out of favor with the adoption of Lumen and GPU Lightmass, but some users may still prefer it.
Starting with the top of the new Xeon CPUs, the w9-3495X is about 14% slower than the Threadripper Pro 5995WX when compiling source code in Visual Studio, which makes sense with it having fewer cores. However, Intel does score a win with shader compiling, where it is 7% faster than AMD.
The 36-core Xeon has some trouble when compiling source code in Visual Studio, and took almost 60% longer to compile the source code than the 32-core Threadripper 5975WX. The previous generation 38-core Xeon had a similar experience in this test, and it is likely due to Windows scheduling issues with oddly balanced processor groups. For anything above 32-cores and 64-threads, Windows has to break up the processors into groups. We’ve seen these sorts of processing issues in the past, where one of the groups doesn’t get utilized as efficiently. One would hope this will be patched, but since the previous generation still exhibits this issue, it seems unlikely. The good news for Intel is that their new CPU does manage to slightly outperform AMD (by 3%) when compiling shaders in Unreal Engine, so this isn’t a completely clean sweep for AMD.
Moving down to the 24-core Xeon w7-3455X, it is about 7% slower than the 24-core Threadripper 5975WX in Visual Studio, while 10% slower in the shader compilation test. It is unclear why this specific Intel CPU didn’t do as well as the others in compiling shaders, but it is something we plan to look into more in the future.
Lastly, the 16-core Xeon w7-3435 is 3% slower than the similar core count Threadripper 5955WX in code compilation and on par for compiling shaders. These two are neck and neck, but it is worth noting that both CPUs are outperformed by the consumer-grade Intel Core i9 13900k, which is also significantly cheaper. It would be hard to recommend either of these lower core-count, pro-grade CPUs for this workload.
Some readers may have noticed that “Build Lighting” is absent from these results. We noticed significant and unexplainable performance discrepancies when we upgraded our tests to Unreal 5.1. For example, most of these CPUs completed the test between 5 and 10 minutes, but the 56-Core Intel w9-3495X took 22 minutes. At first, we would have chalked this up to a Windows scheduling issue, as discussed earlier, but then we tested the 16-core w5-3435X which took well over 2 hours to complete the same task. We even tested with a fresh engine install and a clean project download from the marketplace. While the Threadripper CPUs all finished within the expected timeframe, it was odd that the 24-core was the fastest, followed by 64, then 16, and finally 32. The last time we tested these CPUs, we used Unreal 4.26 and didn’t have these issues. Most 5.1 users are utilizing Lumen or GPU Lightmass instead, so we decided to leave this test out until we can track down exactly what is going on.
CPU Rendering: Cinebench
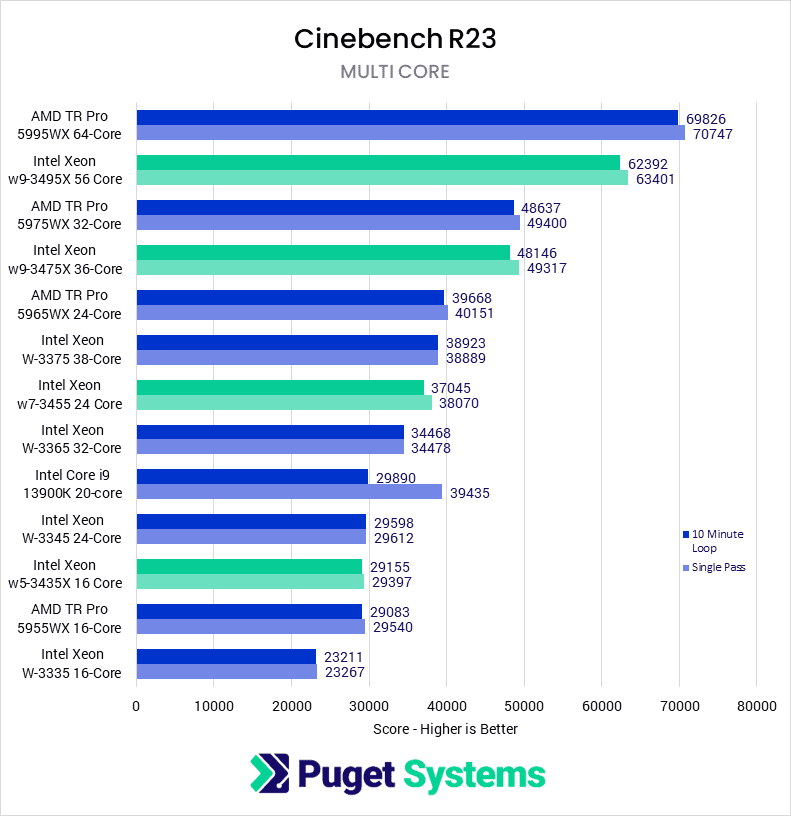
The next few benchmarks focus on CPU-based rendering, an area where processors with high core counts dominate the charts. AMD has had a lead here for quite some time with their 64-core Threadripper PRO 5995WX, but Intel’s new 56-core Xeon w9-3495X aims to close the gap. In the Cinebench R23 benchmark from Maxon, the Xeon does come close with a score of 62392, compared to the 64-core Threadripper score of 69826: a difference of 11%. On a points-per-core basis, these two CPUs are pretty close – although AMD still has the lead in terms of max performance.
This continues down the stack with the 36-core Xeon w7-3475 which scores 48146. There isn’t a 36-core Threadripper, so comparing it to the 32-core Threadripper Pro 5975WX is the closest match. Interestingly, Intel cannot completely overtake AMD with the w7-3475, even with a slight core count advantage. In the 10-minute loop (which more closely resembles real-world rendering workloads) Intel is 1% behind, but this is within the run-to-run variance of Cinebench. Intel does manage to tie when only rendering a single frame, which takes less than a minute. When looking at the previous generation, we can compare it to the 38-core W-3375. The new CPU manages almost 24% faster performance with two fewer cores.
The Intel Xeon w7-3455 24 core provides the most direct comparison with AMD, as the Threadripper Pro 5965WX also has 24 cores. Here we see that AMD is just shy of 7% faster, showing that Intel has almost caught up to AMD for CPU rendering performance. The previous generation Xeon also had a 24-core CPU (the W-3345), and the new w7-3455 gives a massive 25% improvement in performance over the older model.
Finally, on to the 16-core CPUs: Intel manages to tie AMD in both the 10-minute loop and the single frame tests. However, it should be noted that there are better choices than these 16-core models for CPU rendering as even the consumer class 13900K is slightly faster while being significantly cheaper. The only disadvantage the 13900K has is that it does not support as much RAM as the professional platforms.
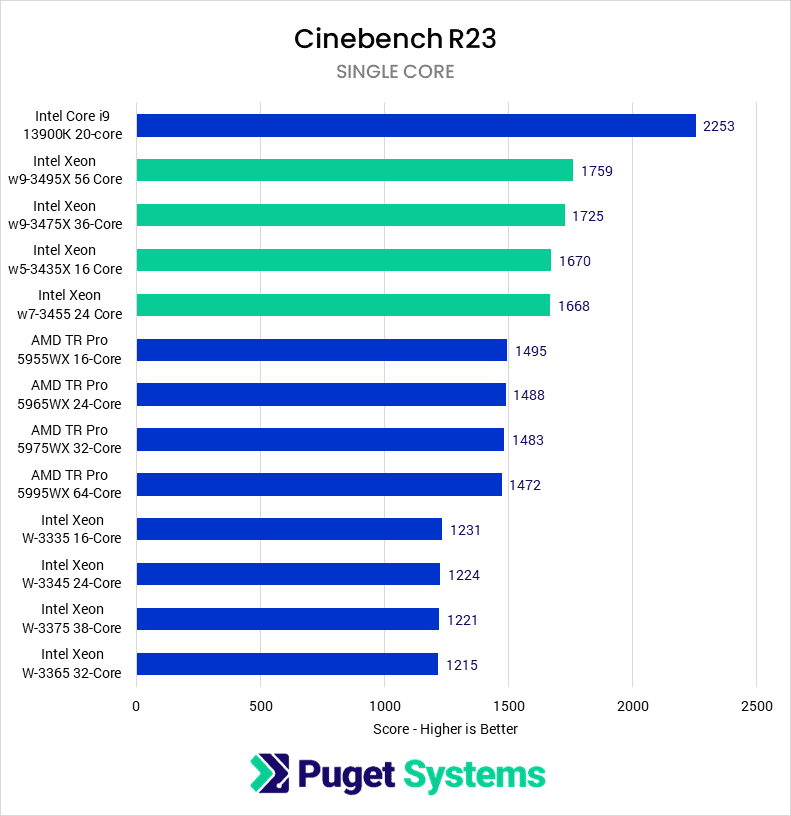
If we look at the single-core results, things are more straightforward. Each CPU family has roughly the same single-core performance. The new Xeons are roughly 15% faster on average than the Threadrippers and 40% faster than the previous generation Xeons. This isn’t really applicable to rendering, as that uses all available cores, but could be indicative of performance in some other applications.
CPU Rendering: V-Ray
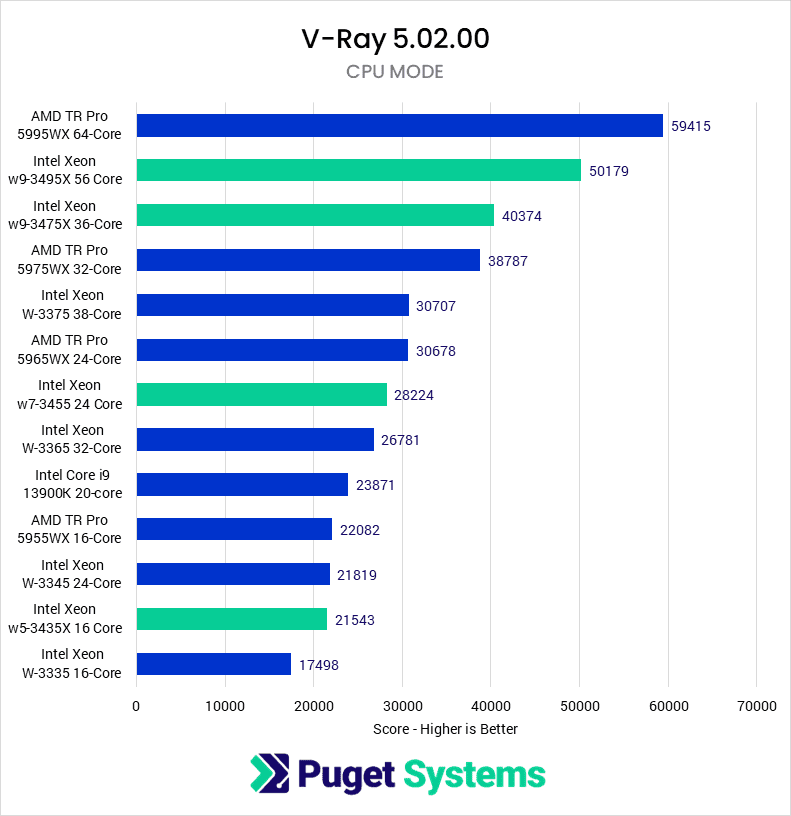
In V-Ray from Chaos, we see results that mirror those of Cinebench. The Xeon w9-3495X is 15% slower than the Threadripper PRO 5995WX but has roughly 12% fewer cores. The w7-3475X does manage to slightly best the closest comparable Threadripper by 4%, but it does have a core advantage, so that is expected.
Moving down to the trio of 24-core CPUs, the new Xeon w7-3455 is within 8% of the Threadripper PRO 5965WX and 30% faster than the previous generation Xeon W-3345. The 16-core CPUs are less than 3% apart. Again, these improvements are welcome, even if they are just catching up to the competition.
CPU Rendering: Blender
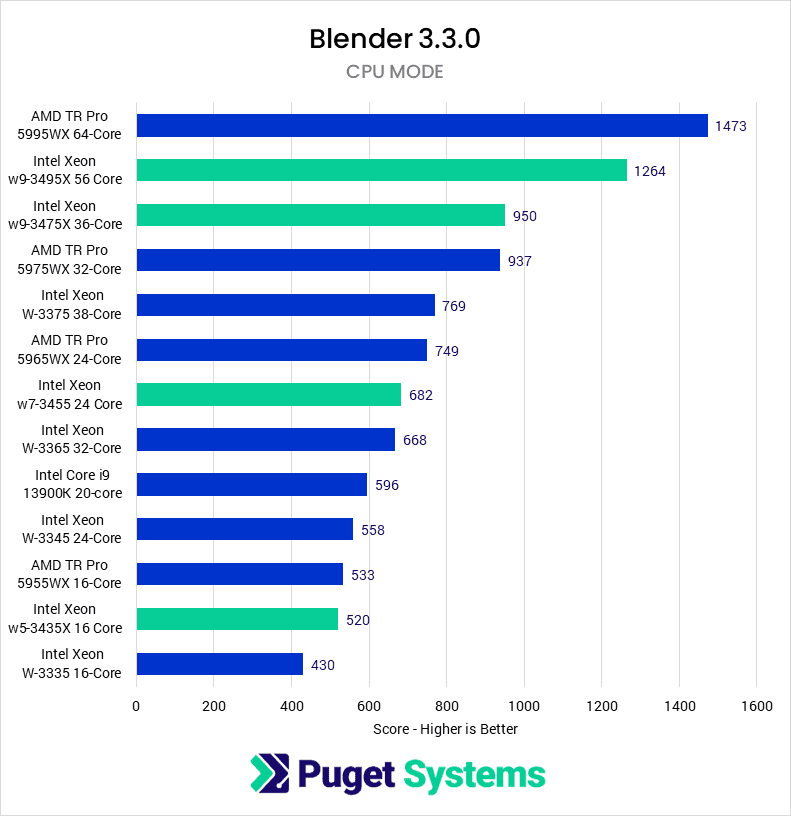
Blender is our final CPU render test. Most Blender users are migrating to GPU rendering, but there are still some cases where CPU is preferred. As we saw in the other rendering benchmarks, the 56-core Xeon w9-3495X is 16% slower than AMD’s top offering, the 64-core Threadripper PRO 5995WX. There is a 12% difference in the number of cores, so the two CPUs have roughly equal per-core performance. Moving on to the 36-core w7-3475X, AMD’s 5975WX holds a slight lead by 5%, leaving the two very close on a per-core comparison.
On the lower end, the Xeon w7-3455 comes in 10% slower than the Threadripper PRO 5965WX – both of which have 24 cores. At the same time, the 16-core offerings are about 3% apart. AMD still holds the lead and is stronger in Blender than the other renderers. As we saw with V-Ray, the new Xeons are ~30% faster than Intel’s previous generation.
How Well Do the Intel Xeon W-3400 Processors Perform for Content Creation?
Overall, the new Intel Xeon W-3400 series of processors are significantly faster than the previous generation, but this comes at the cost of much higher power consumption. And while the gen-over-gen performance is great in many cases, outside of a few isolated workloads, it is only enough to (at best) bring Intel on par with AMD’s Threadripper PRO 5000 WX-Series processors. In most cases, AMD maintains a small but measurable performance edge. This, combined with AMD’s lower power consumption, is going to make them a more attractive option than the new Xeon W-3400 processors in most content creation workflows.
For video editing applications like Premiere Pro and DaVinci Resolve, AMD has about a 10-15% performance lead over the new Xeons. This isn’t much, but the big issue for Intel is that if you drill down to specific workloads, the new Xeons lag behind even more when working with RAW codecs – which is one of the main areas where the performance benefits of Xeon and Threadripper PRO CPUs are often worth the investment. Combined with the high power draw of the Xeon W-3400 CPUs, this makes it hard to recommend these Xeon processors for video editing.
Motion Graphics and VFX workloads in After Effects are much faster with the new Xeons compared to the previous generation, but again, AMD maintains their lead in most cases. Here, AMD is generally about 10% faster than Intel, except for the Xeon w7-3435X 16-Core, where Intel has a clear win – coming in at 10% faster than the AMD TR PRO 5955WX 16-Core. However, that is only a consideration if you need more than 128GB of RAM, but can’t afford a more powerful processor. If 128GB of RAM is enough for your work, then the Intel Core i9 13900K is going to be much faster than either of those CPUs, and at a far lower price.
In Unreal Engine, performance was a mixed bag. AMD still holds an advantage when compiling the source code in Visual Studio, although Intel can match or be slightly faster at building shaders. While we welcome performance improvements, breaking even with the year-old AMD CPUs is hard to get excited about, especially as we experienced issues with light baking taking significantly longer for reasons we have yet fully figured out – and likely Windows scheduling issues with higher core count CPUs.
CPU rendering is another area with impressive gen-over-gen gains, with the new Xeon CPUs seeing up to a 30% improvement over the previous generation W-3300 processors. However, even with this massive performance uplift, it is only enough to bring them about on par with Threadripper PRO on a performance-per-core standpoint, and in some cases, AMD continues to maintain a decent lead.
In general, while the new Xeon W-3400 series processors are a big step in the right direction for Intel, they can only barely keep up with AMD’s Threadripper PRO CPUs in most situations. And in many areas, AMD maintains a solid performance lead. Intel also has a lot of work to do around the power draw of these CPUs. As an example, the new Intel Xeon W9-3495X 56-Core used about 50% more power to complete the same benchmark run as the AMD Threadripper PRO 5995WX 64-Core. And since the performance was generally lower than AMD, that means it uses significantly more power for overall less performance.
While the Intel Xeon W-3400 processors are not particularly great for the workflows we tested in this article, we do want to note that there are some areas where these CPUs should be terrific, namely AI and machine learning. We plan to have some performance numbers for these processors in the near future, but our preliminary testing is looking extremely good for Intel.
The W-3400 and W-2400 lines can also be a solid option for workflows that don’t need a lot of CPU power but do need lots of RAM or PCIe lanes. This is especially true for the W-2400 line, where there are CPU models like the Xeon w3-2435 which can get you 64 PCIe lanes (enough for 4 GPUs) for less than $700. That frees up more of your budget to spend on other aspects of the system, rather than dumping a sizeable chunk into a processor that is overpowered for your needs.
But for content creation workflows where CPU performance matters, the AMD Threadripper PRO 5000 WX-Series processors will almost always be the better choice over the Intel Xeon W-3400 line.
If you are looking for a workstation for any of the applications we tested, you can visit our solutions page to view our recommended workstations for various software packages, our custom configuration page, or contact one of our technology consultants for help configuring a workstation that meets the specific needs of your unique workflow.


