Table of Contents
Introduction
Recently, Intel announced their new “Sapphire Rapids” Xeon family of processors, encompassing three distinct product lines: Intel Xeon W-2400, Intel Xeon W-3400, and the 4th Gen Intel Xeon Scalable processors. As far as workstations go, the W-2400 and W-3400 lines are the ones we are most interested in, and today we are going to provide what we are calling a “preview” of the Xeon W-3400 series for content creation workflows.
The reason we are using the term “preview” is that the platform is very much still in development, and we still have quite a while (in hardware launch terms) before these products will be available for purchase. While you can pre-order them right now from various system integrators, the sales embargo of the W-2400 series isn’t until March, and the W-3400 isn’t until April. It is actually a bit unusual that we can share performance testing this early, as there is often a flurry of BIOS and/or driver updates up to the sales date.
And right now, we are right in the middle of that flurry. There are some GPU compatibility issues Intel is actively addressing, and we are aware of at least one BIOS update that should increase performance for these processors. Because of this, we highly recommend you take these results as a “peek behind the curtain” rather than an indication of final performance. If you talk to any hardware reviewer who has access to pre-launch hardware, they will confirm that updates right up until the day before an embargo is not unusual. And in this case, we have one to two months of updates and optimizations before the sales embargo lifts.
Ongoing optimizations aside, in the official launch announcement for these CPUs, Intel claims “up to 28% single-thread1 and up to 120% multithread performance improvements2 over the previous generation”. This compares the new Xeon w9-3945X 56 Core to the previous generation Xeon W-3275 28 Core, so the multithreaded performance claims aren’t quite as large as it sounds at first read. The increase in single-threaded performance, however, is very welcome, as that has long been a weak area for the high core count Xeon processors in particular.
These performance claims are something we want to check, but to start, we first want to clarify the difference between the W-2400 and W-3400 product lines:
| W-2400 (Mainstream Workstation Processors) | W-3400 (Expert Workstation 1S Processors) | |
|---|---|---|
| Socket | LGA 4677 | LGA 4677 |
| CPU PCIe Lanes | 64 | 112 |
| Memory Channels | 4 | 8 |
| Max Cores/Threads | 24/48 | 56/112 |
| Base Power | 110-225W | 270-350W |
| Max Memory | 2TB DDR5 | 4TB DDR5 |
| Overclocking | Select Models | Select Models |
As you can see, the W-3400 line is mostly a scaled-up version of the W-2400 processors. Double the memory channels and maximum memory capacity, more than twice the core count, 75% more PCIe lanes, and a much higher power draw at the top end. While both use the LGA 4677 socket, it is important to know that the heat spreaders are physically different, so you need a different carrier for each line, although both carriers will presumably come with either your motherboard or heatsink.
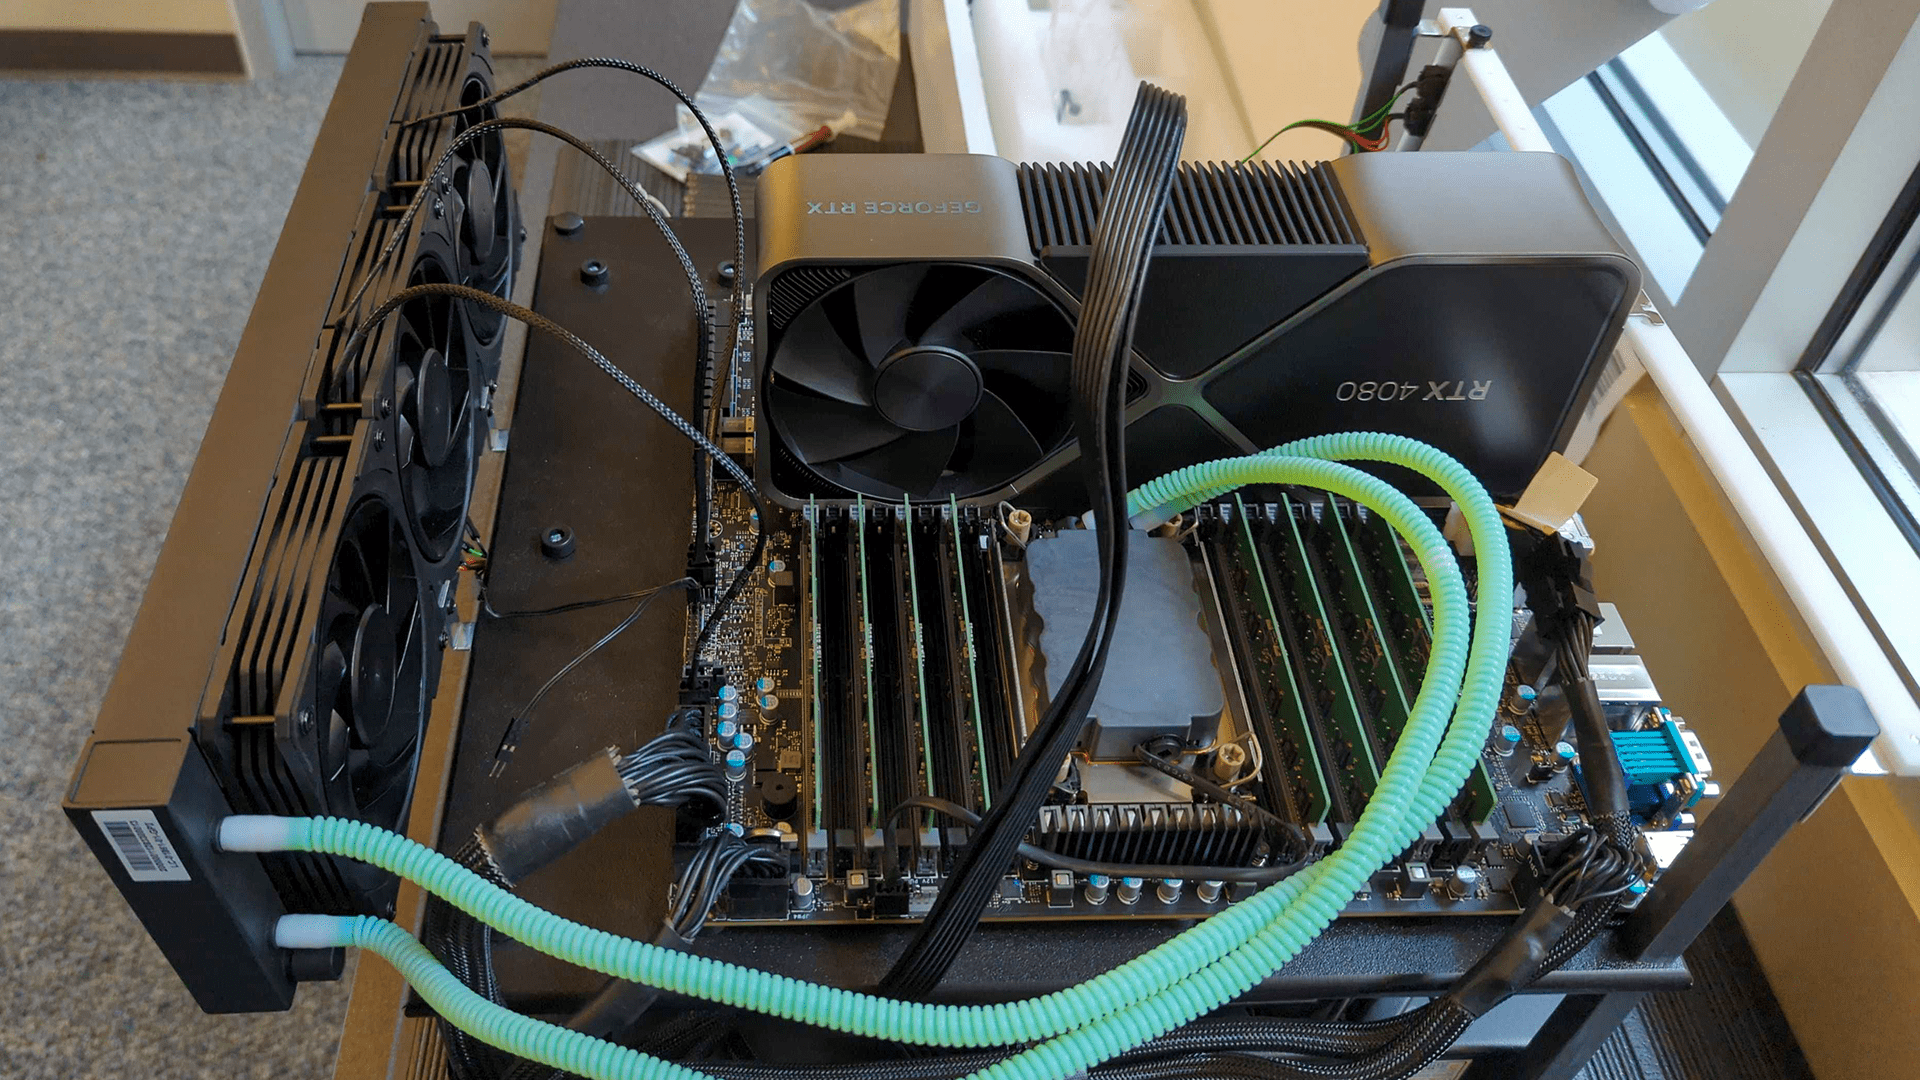
The higher power draw is one of our big concerns about the W-3400 line, and Intel provided us with a 3x120mm AIO liquid cooler to use on the higher-wattage CPUs. For now, we decided to use it across the board, but thermal testing to see when, and if, this level of cooler is required is something we intend to look at in the future.
The last thing we want to make sure to point out is that overclocking is now a supported feature for Xeon. In our opinion, overclocking is contrary to one of the main goals of a workstation-class product (stability and reliability), but as long as motherboard manufacturers don’t start auto-overclocking like they tend to do on consumer platforms, it shouldn’t cause any issues for the typical user.
Intel is providing a wide range of processors to choose from, with eight models in the W-2400 line, and seven in the W-3400 line. This results in a large list of total CPUs, so we are (for now) going to focus on the W-3400 line.
| Cores/ Threads | Smart Cache (L3) | Max Frequency | Base Frequency | Max Memory Speed | Unlocked | Power (Base/Max) | MSRP | |
|---|---|---|---|---|---|---|---|---|
| TR PRO 5995WX | 64/128 | 256MB | 4.5GHz | 2.7GHz | DDR4 3200 | Yes | 280W | $6,499 |
| w9-3495X | 56/112 | 105MB | 4.8GHz | 1.9GHz | DDR5 4800 | Yes | 350W | $5,889 |
| W-3375 | 38/76 | 57MB | 4.0GHz | 2.5GHz | DDR4 3200 | No | 270W | $4,951 |
| W-3365 | 32/34 | 48MB | 4.0GHz | 2.7GHz | DDR4 3200 | No | 270W | $3,851 |
| w9-3475X | 36/72 | 82.5MB | 4.8GHz | 2.2GHz | DDR5 4800 | Yes | 300W | $3,739 |
| TR PRO 5975WX | 32/64 | 128MB | 4.5GHz | 3.6GHz | DDR4 3200 | Yes | 280W | $3,299 |
| w7-3465X | 28/56 | 75MB | 4.8GHz | 2.5GHz | DDR5 4800 | Yes | 300W | $2,889 |
| W-3345 | 24/48 | 36MB | 4.0GHz | 3.0GHz | DDR4 3200 | No | 250W | $2,751 |
| w7-3455 | 24/48 | 67.5MB | 4.8GHz | 2.5GHz | DDR5 4800 | No | 270W | $2,489 |
| TR PRO 5965WX | 24/48 | 128MB | 4.5GHz | 4.0GHz | DDR4 3200 | Yes | 280W | $2,399 |
| w7-3445 | 20/40 | 52.5MB | 4.8GHz | 2.6GHz | DDR5 4800 | No | 270W | $1,989 |
| w5-3435X | 16/32 | 45MB | 4.7GHz | 3.1GHz | DDR5 4800 | Yes | 270W | $1,589 |
| W-3335 | 16/32 | 24MB | 4.0GHz | 3.4GHz | DDR4 3200 | No | 250W | $1,430 |
| w5-3425 | 12/24 | 30MB | 4.6GHz | 3.2GHz | DDR5 4800 | No | 270W | $1,189 |
| W-3323 | 12/24 | 21MB | 3.9GHz | 3.5GHz | DDR4 3200 | No | 220W | $1,043 |
Compared to the previous W-3300 line, the new W-3400 processors are a bit less expensive per core, although the addition of the 56-core model does raise the pricing at the very top end, although not quite to the level of the AMD Threadripper PRO 5995WX. MSRP can be misleading for this type of product, however, as these CPUs are intended to primarily be sold as a part of an entire workstation, and not as an individual part. Because of that, pricing can change based on numerous deals system integrators may have access to, but also impacted by the markup applied by those same integrators.
In terms of specs, the maximum frequency has seen a healthy bump of about .8GHz on many of the models, which, combined with the move to DDR5 and general architecture improvements, should increase the performance of these CPUs in lightly threaded tasks. L3 Cache has also seen almost a 2x bump per core, with the w9-3495X topping out at a massive 105MB of cache.
The big downside to the new CPUs is the high power draw at the top end. Even 300W for the w9-3475X and w9-3465X is higher than we would like, and the w9-3495X blows past that at 350W. Keep in mind that this is just the base power – the maximum power draw during Turbo is rated to be 1.2x higher, which means that the w9-3495X can pull up to 420W under full load.
Test Setup
Intel Xeon W-3400 Test Platform
| CPUs: Intel Xeon w9-3495X 56 Core Intel Xeon w7-3465X 28 Core Intel Xeon w7-3455 24 Core |
| CPU Cooler: 3x120mm AIO Liquid Cooler |
| Motherboard: Supermicro X13SWA-TF |
| RAM: 8x Kingston DDR5-4800 ECC Reg. 1R 16GB (128GB total) |
| GPU: NVIDIA GeForce RTX 4080 16GB |
| PSU: Super Flower LEADEX Platinum 1600W |
| Storage: Samsung 980 Pro 2TB |
| OS: Windows 11 Pro 64-bit (22621) |
Intel Core 13th Gen Test Platform
| CPU: Intel Core i9 13900K 8+16 Core |
| CPU Cooler: Noctua NH-U12A |
| Motherboard: Asus ProArt Z690E-Creator WiFi |
| RAM: 2x DDR5-4800 32GB (64GB total) |
| GPU: NVIDIA GeForce RTX 4080 16GB |
| PSU: Super Flower LEADEX Platinum 1600W |
| Storage: Samsung 980 Pro 2TB |
| OS: Windows 11 Pro 64-bit (22621) |
AMD Threadripper PRO Test Platform
Benchmark Software
| Photoshop 24.1.1 PugetBench for Photoshop 0.93.6 |
| After Effects 23.2 PugetBench for After Effects 0.95.6 |
| Premiere Pro 23.1.0 PugetBench for Premiere Pro 0.95.6 |
| DaVinci Resolve 18.1.3 PugetBench for DaVinci Resolve 0.93.2 |
| Unreal Engine 4.26 |
| Cinebench R23.2 |
| Blender 3.4.0 |
| V-Ray 5.02.00 |
To see how the new Xeon W-3400 processors perform, we will primarily compare them to similar core count models from the previous generation W-3300 line, as well as AMD’s Threadripper PRO 5000 Series processors. In addition, we will also toss the Intel Core i9 13900K into the mix. This CPU is from a completely different family, and in many ways doesn’t belong in a comparison between Xeon and Threadripper PRO products as it has much less memory capacity and has far fewer PCIe lanes. However, CPUs like the Core i9 13900K tend to be much faster for lightly threaded workloads like Photoshop and After Effects, so we wanted to include it to provide context for where you might want to invest in a Xeon or Threadripper PRO platform, and where a lower cost option may be a better fit.
On all the platforms, we will be using the “High Performance” Windows power profile. This doesn’t impact AMD Threadripper Pro or the Intel Core 13th Gen processors much, but as we will show in the next section, it makes a massive difference for Intel Xeon.
Beyond the CPU and motherboards, we will be standardizing on the same GPU (RTX 4080), storage (Samsung 980 Pro 2TB), and OS (Windows 11 with the latest updates). We will use many of our PugetBench series of benchmarks, along with several CPU rendering benchmarks to see how they perform under highly threaded workloads.
Windows Power Profiles Impact on Xeon Performance
Before we get too far into our testing, we want to investigate something that has been a major factor with Intel Xeon CPUs for the last several generations, which is that performance can be significantly impacted in lightly & moderately threaded workloads if you use to the default “Balanced” power profile in Windows. This setting is easy enough to change, but we generally perform our testing with as stock of settings as possible, so we wanted to take the time to show just how important it is with Xeon to switch to the “High Performance” power profile.
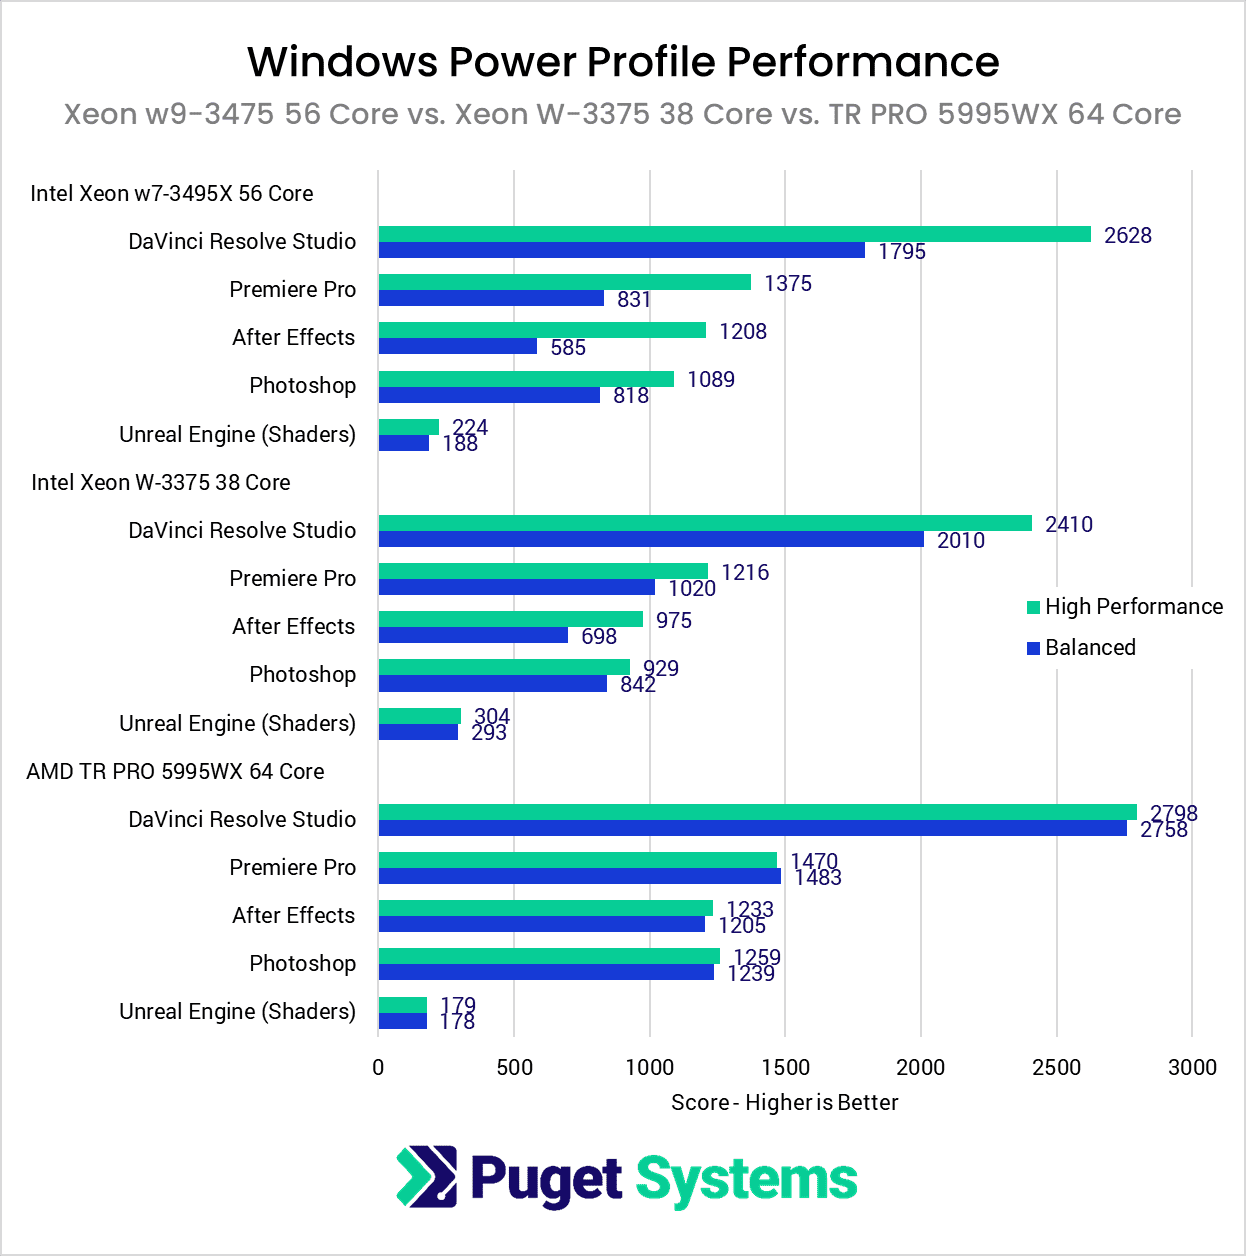
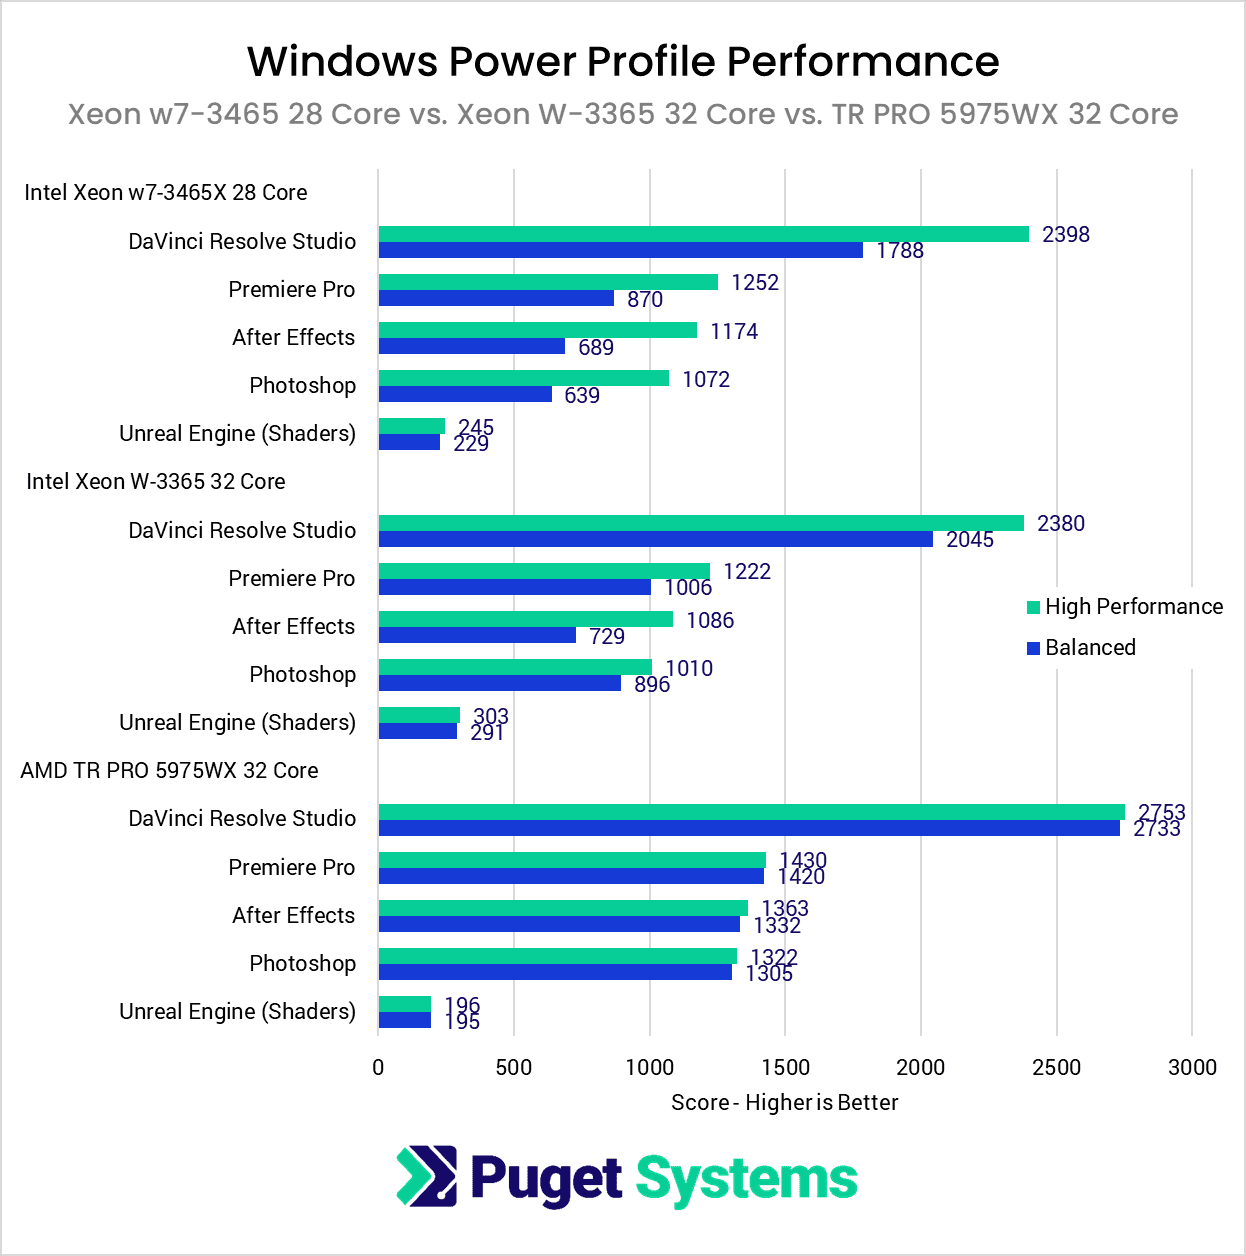
To start, let’s take a look at how big of an impact this can make on performance for CPUs from the AMD Threadripper PRO 5000 Series, the previous generation Intel Xeon W-3300 Series, and the new Intel Xeon W-3400 Series.
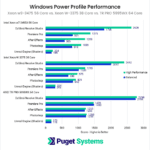
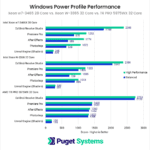
In the two charts above, we are showing performance across the lightly and moderately threaded applications we will be looking at throughout this article. More highly threaded tasks like CPU rendering are largely unaffected, so we left them out of the chart. As you can see, for AMD’s Threadripper PRO CPUs, switching between the default “Balanced” and “High Performance” power profiles doesn’t make much difference for performance. A few percent here or there, but nothing significant.
The previous generation Intel Xeon W-3300 Series processors, however, can see anywhere from just a few percent to almost a 50% increase in performance by changing the Windows power profile. That is a big difference, but it turns out to be even more significant with the new Xeons. For the high core count Intel Xeon W-3495X 56 Core in particular, we are seeing anywhere from 20% to more than 2x higher performance when using the “High Performance” power profile.
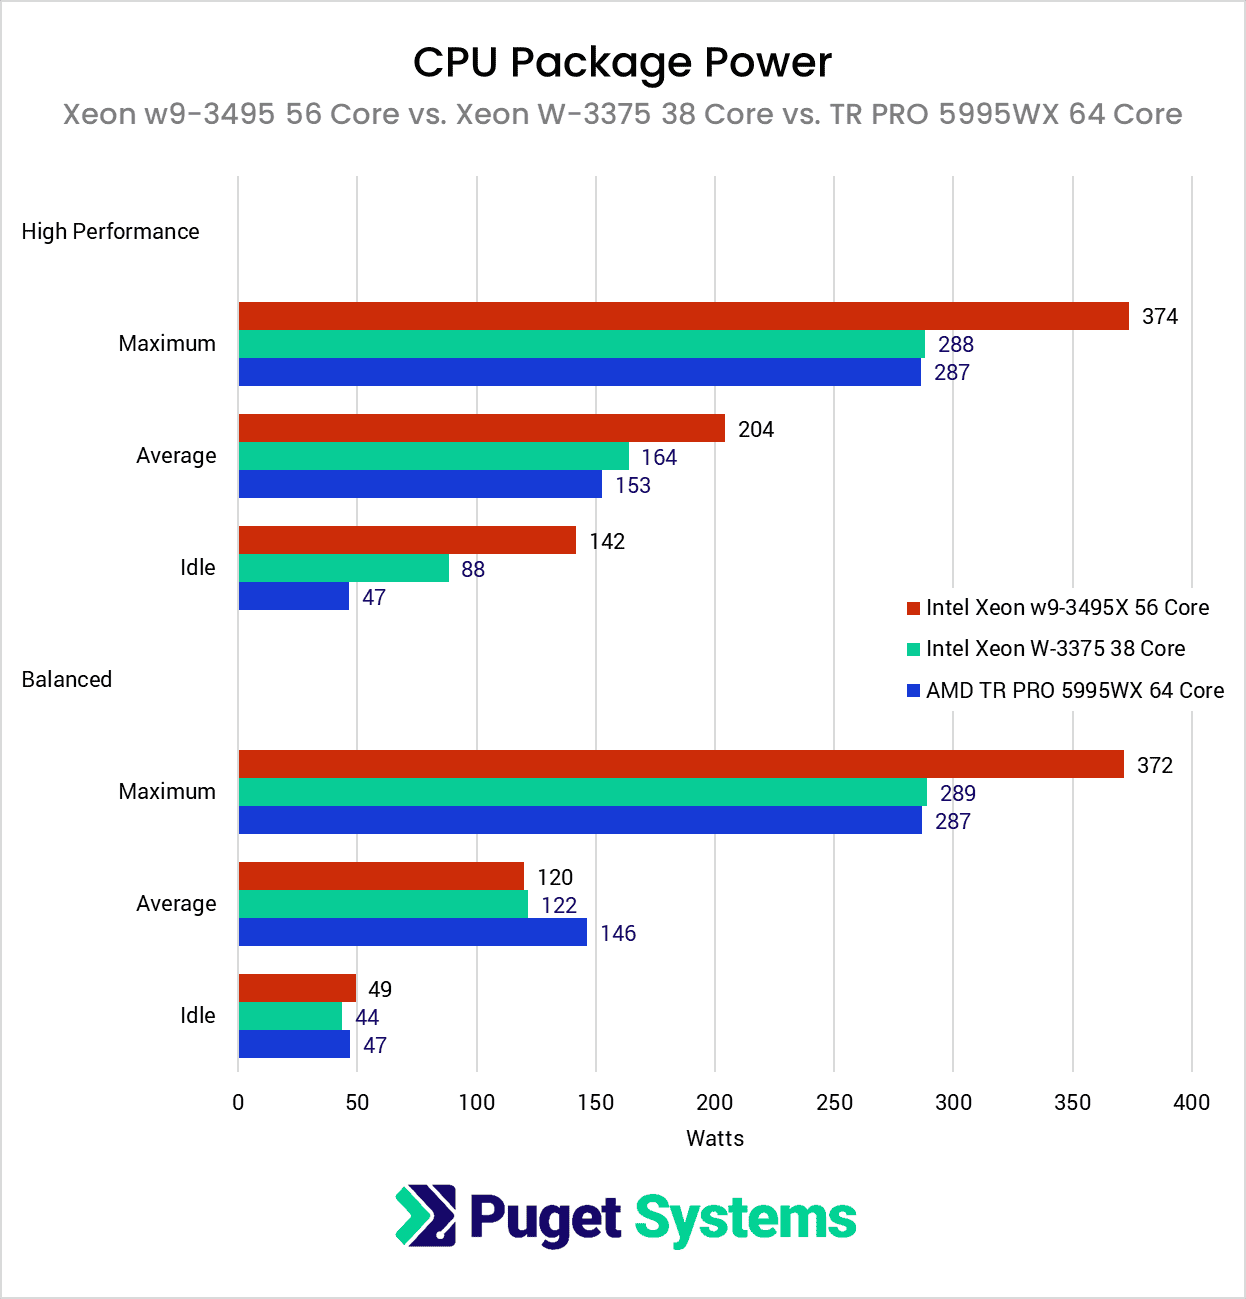
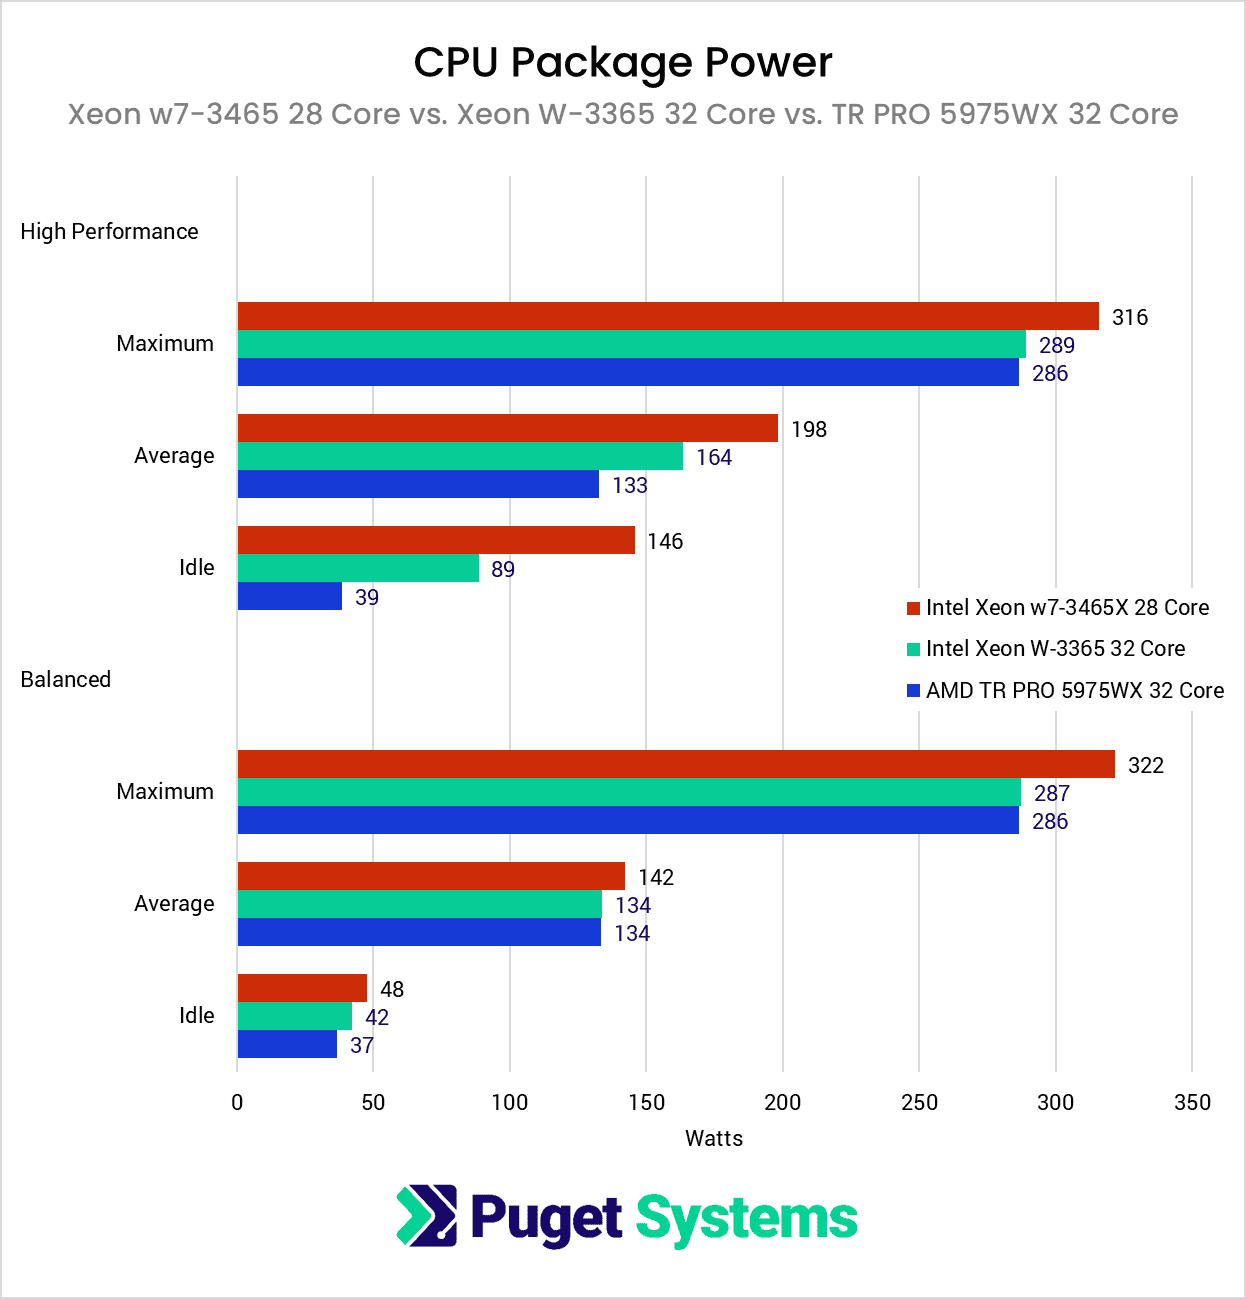
Changing the power profile is not just free performance, and has a downside in that it tends to increase the power draw of the CPU while idle and when under light loads. We have recently been running HWiNFO alongside our benchmarks, and one of the things it can log is the total CPU package power. This is based on sensor data, so maybe slightly off from the actual power draw, but it should be more than accurate enough to give us a good picture of how the Windows power profile impacts the power draw. This gets very complex when broken down by workload, but it is easy enough for us to calculate the idle, maximum, and average power draw across an entire benchmark run.
Once again starting with AMD, notice how the idle, average, and max power draw don’t change much when we changed the power profiles. That is in line with the fact that performance doesn’t change much, so the Windows power profile makes little difference.
For Intel, however, the idle power draw in particular increases significantly. On the previous generation Xeon X-3300 series, we are looking at about a 2x increase, going from 44W to 88W on the Xeon W-3375 38 Core. The difference is even larger on the new Xeons, with the w9-3495 going from 49W to 142W – nearly a 3x increase in idle power draw.
This is going to impact the system in two main ways: the cooler is going to have to work harder at idle (and thus be a small amount louder), and it will cost a bit more money to run your system. The raw costs aren’t that high in the context of the price of a system of this level (assuming it is idle 24/7/365, and energy cost is 15 cents per kWh, that is only a maximum difference of about $120 per year), but it is still a factor to consider.
With this information, we decided to present the results in this article using only the “High Performance” Windows power profile. We actually did all our testing with both profiles to see how much of an impact it made on each CPU, but since Intel Xeon benefits to much from using the “High Performance” profile, we are going to (for now) stick to presenting just those results.
Video Editing: DaVinci Resolve Studio
To start, we will look at the most complicated of our results: DaVinci Resolve Studio. Many of our benchmarks include both an “Overall Score” and various sub scores for various workflows, which are often relatively in line with the overall score. This time, however, things change quite a bit depending on the test, so we feel it is worth diving a bit deeper.
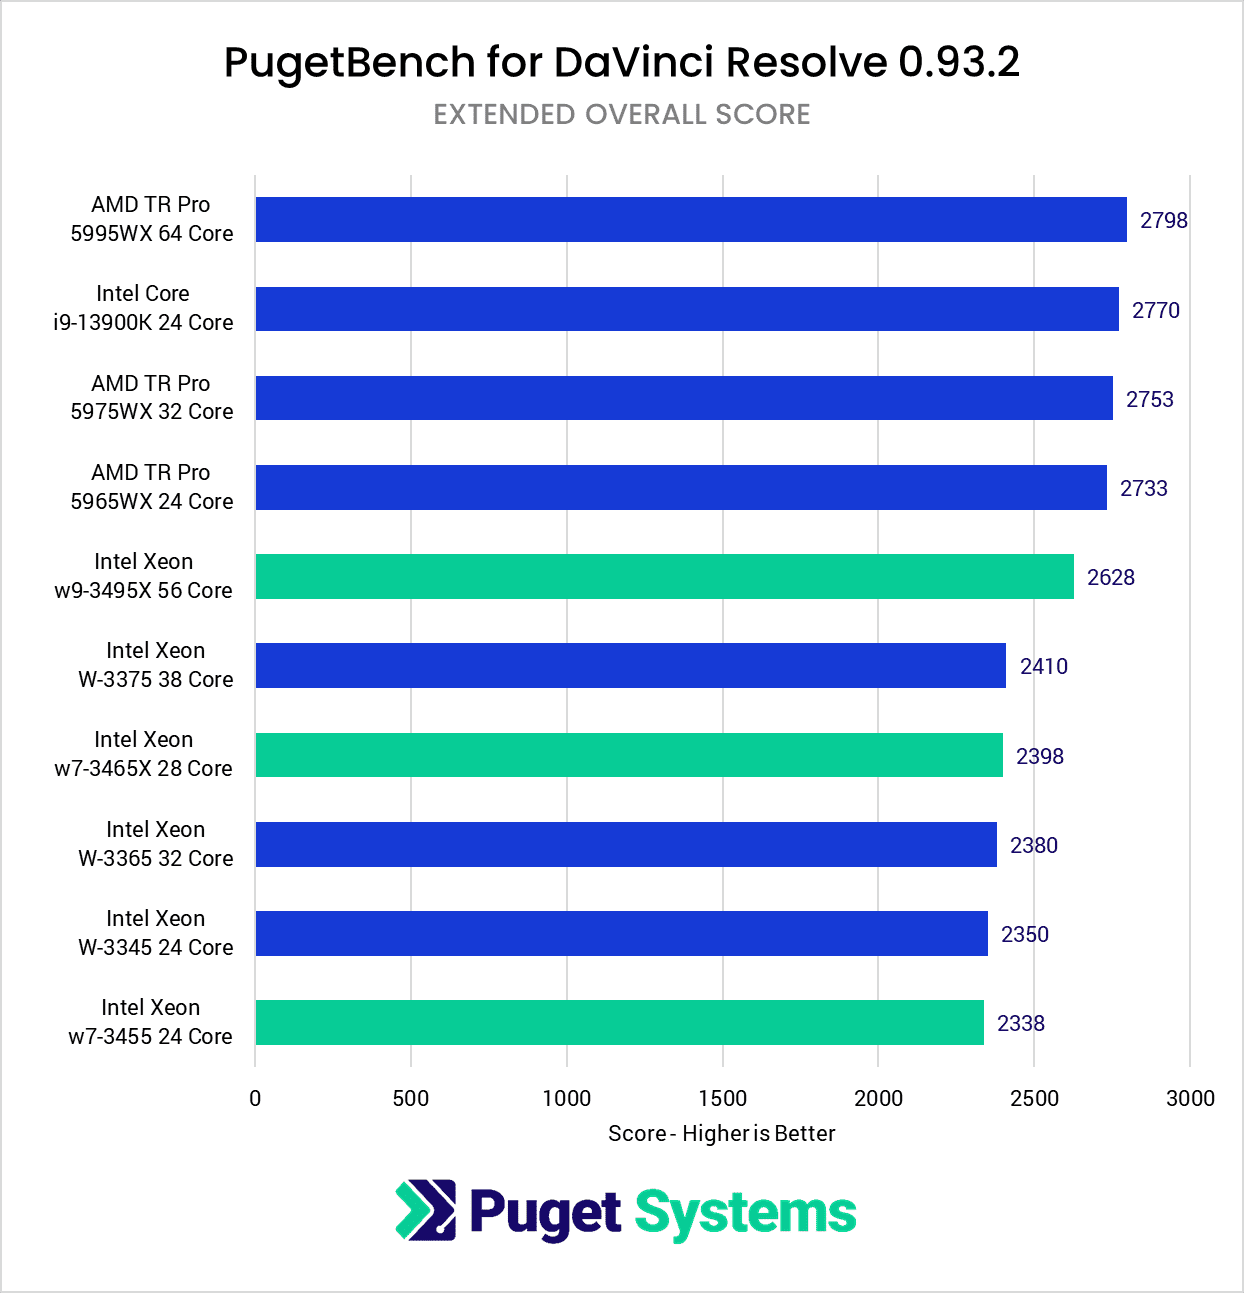
Again, we want to stress that these are early results, and upcoming optimizations will likely change things – possibly dramatically. But for now, in terms of overall performance in Resolve, the new Xeon W-3400 CPUs scored about on par with the W-3300 processors. Only the 56 core w9-3495X saw a performance increase, and that is likely due to the simple fact that it has vastly more cores than the previous generation. In any case, Intel is still trailing AMD for now, although they do have some areas that they are already doing very well.
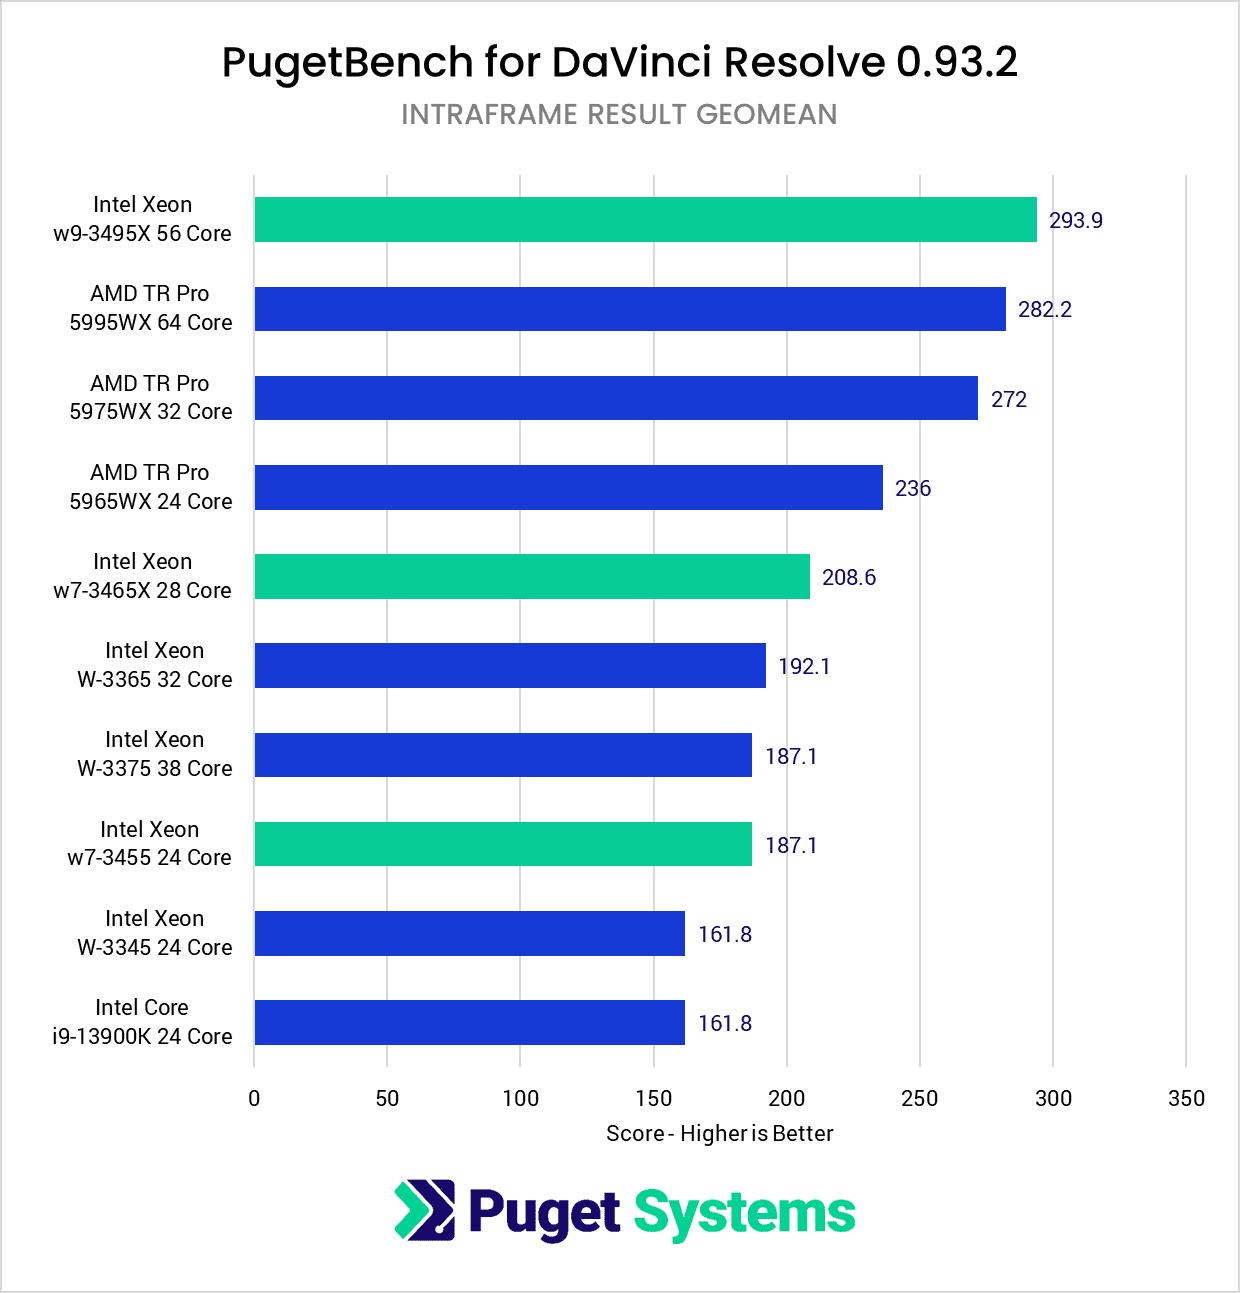
The area Intel is strongest is working with intraframe codes like ProRes. These codecs are considered the ideal type of codec to use for editing, and extremely common in high-end workflows. For these, the new Xeon w9-3495X does particularly well, beating the more expensive AMD Threadripper PRO 5995WX by a few percent. The w7-3465X and w7-3455 don’t do quite as well against AMD, but are still a good 10-15% faster than the previous generation.
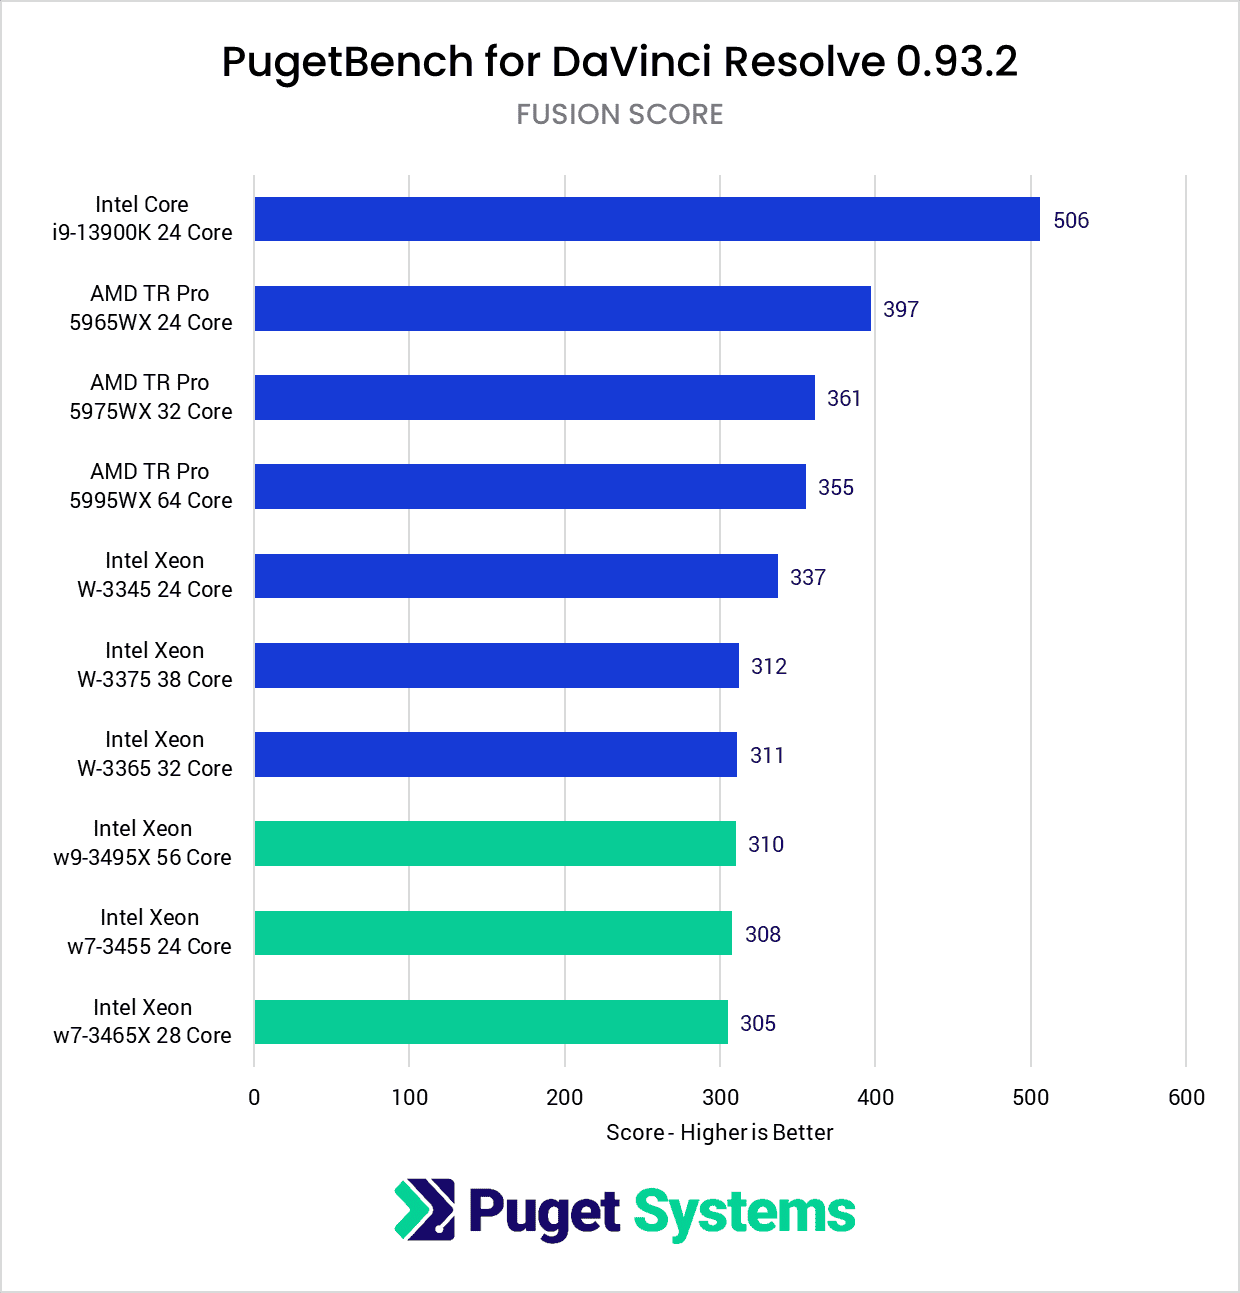
RAW codecs like RED and BRAW are more in AMD’s favor still, as is performance in Fusion which is used for VFX, titles, and other motion graphics. Fusion is a particular issue for the new Xeons at the moment, as they are only on par (or slightly behind) the previous generation. We will note that Fusion tends to have some odd issues at times, so this may well be on Blackmagic to fix, and not Intel.
Video Editing: Adobe Premiere Pro
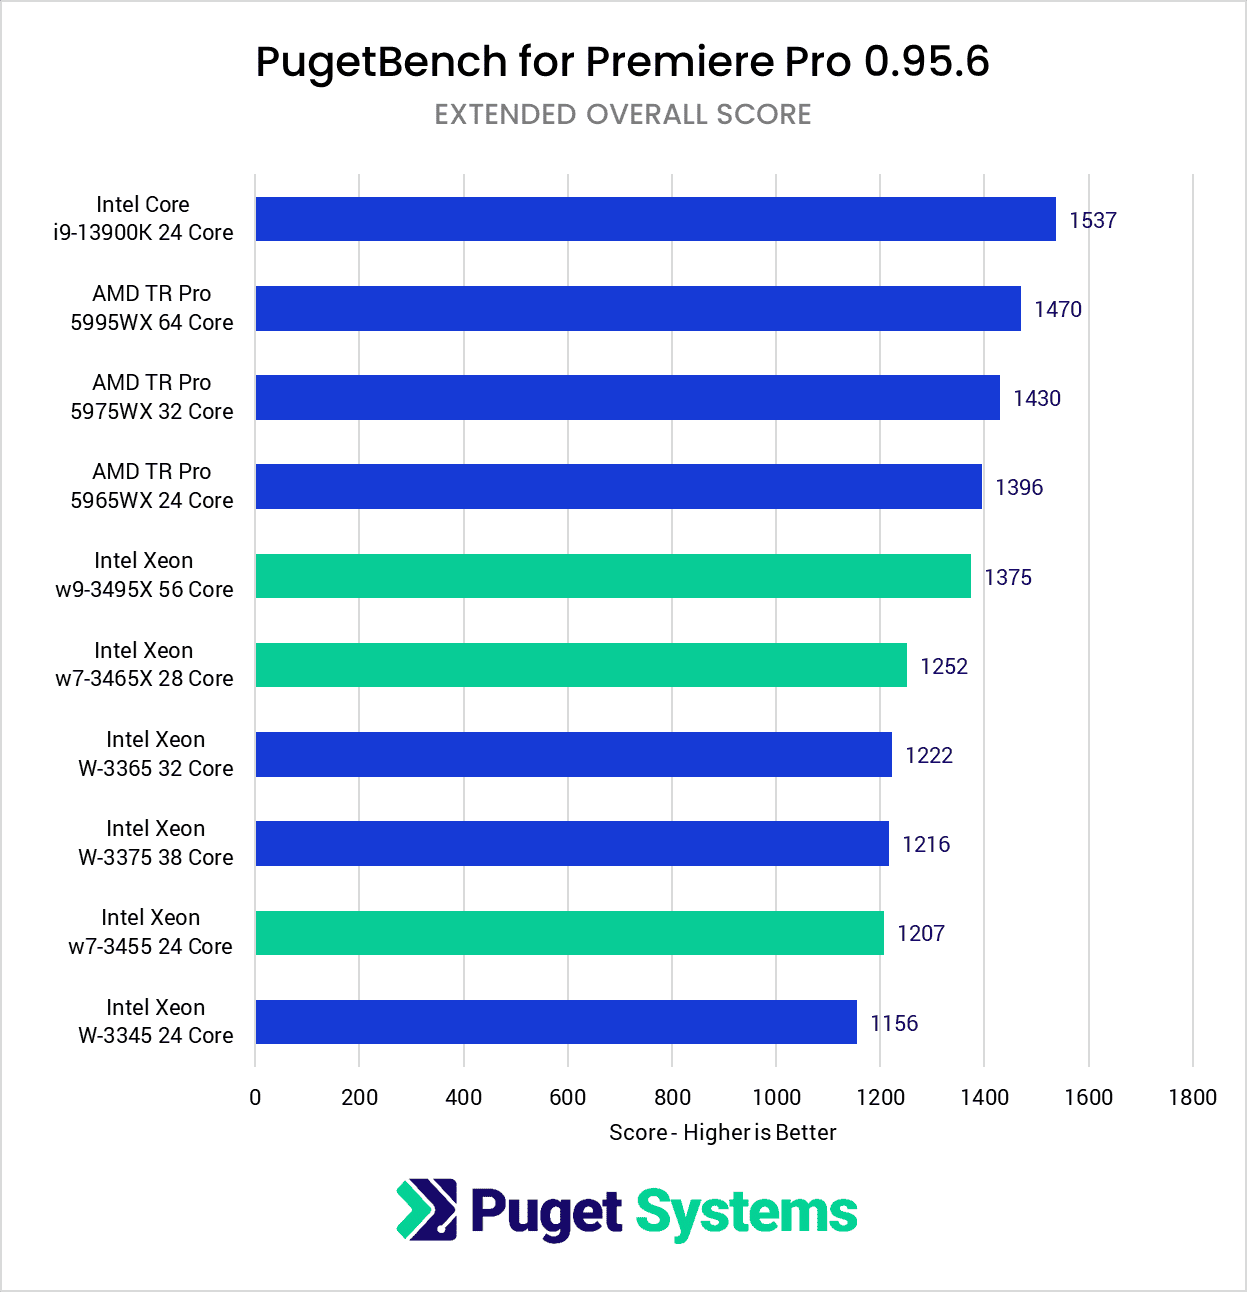
Adobe Premiere Pro is another area where we are hoping upcoming optimizations will improve performance. Overall, the new Xeons are a few percent faster than the previous generation, but nowhere near where we would expect them to be. This is particularly evident when working with RAW codecs, which is one of the main workflows where you would invest in a higher core count CPU.
For RAW codecs, the new Xeons are barely faster than the previous generation, and well behind AMD. For context, the new Xeon w9-3495X 56 Core is only slightly faster than the AMD Threadripper PRO 5965WX 24 Core, despite being almost 2.5x the cost.
Motion Graphics: After Effects
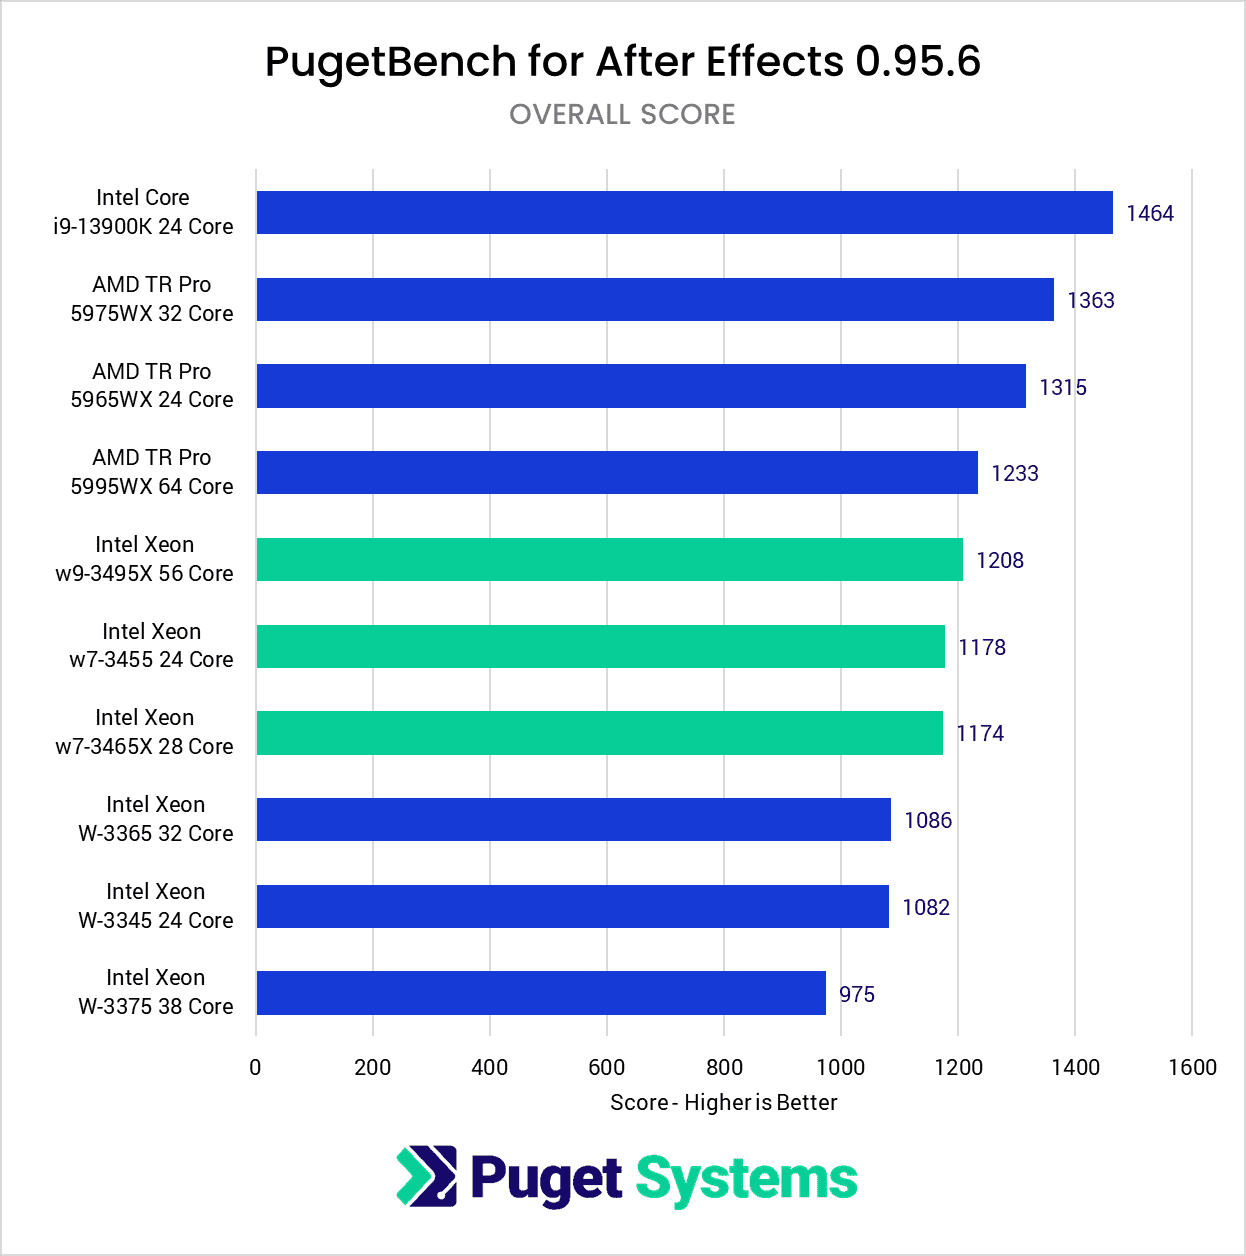
After Effects is interesting as there are two distinct workflows that often dictate whether you should use an Intel Core/AMD Ryzen platform, or a Xeon/Threadripper PRO one. The majority of users will be better served by a CPU like the Intel Core 13900K, as you can see with it being much faster in terms of overall performance than any of the Xeon or Threadripper PRO CPUs we tested. However, Intel Core (and AMD Ryzen) processors have limited RAM capacity (128GB max), which isn’t enough for high-end workflows working on long, complex compositions. In addition, those same projects tend to benefit most from the Multi-Frame Rendering (MFR) feature in After Effects, which works best on higher core count CPUs.
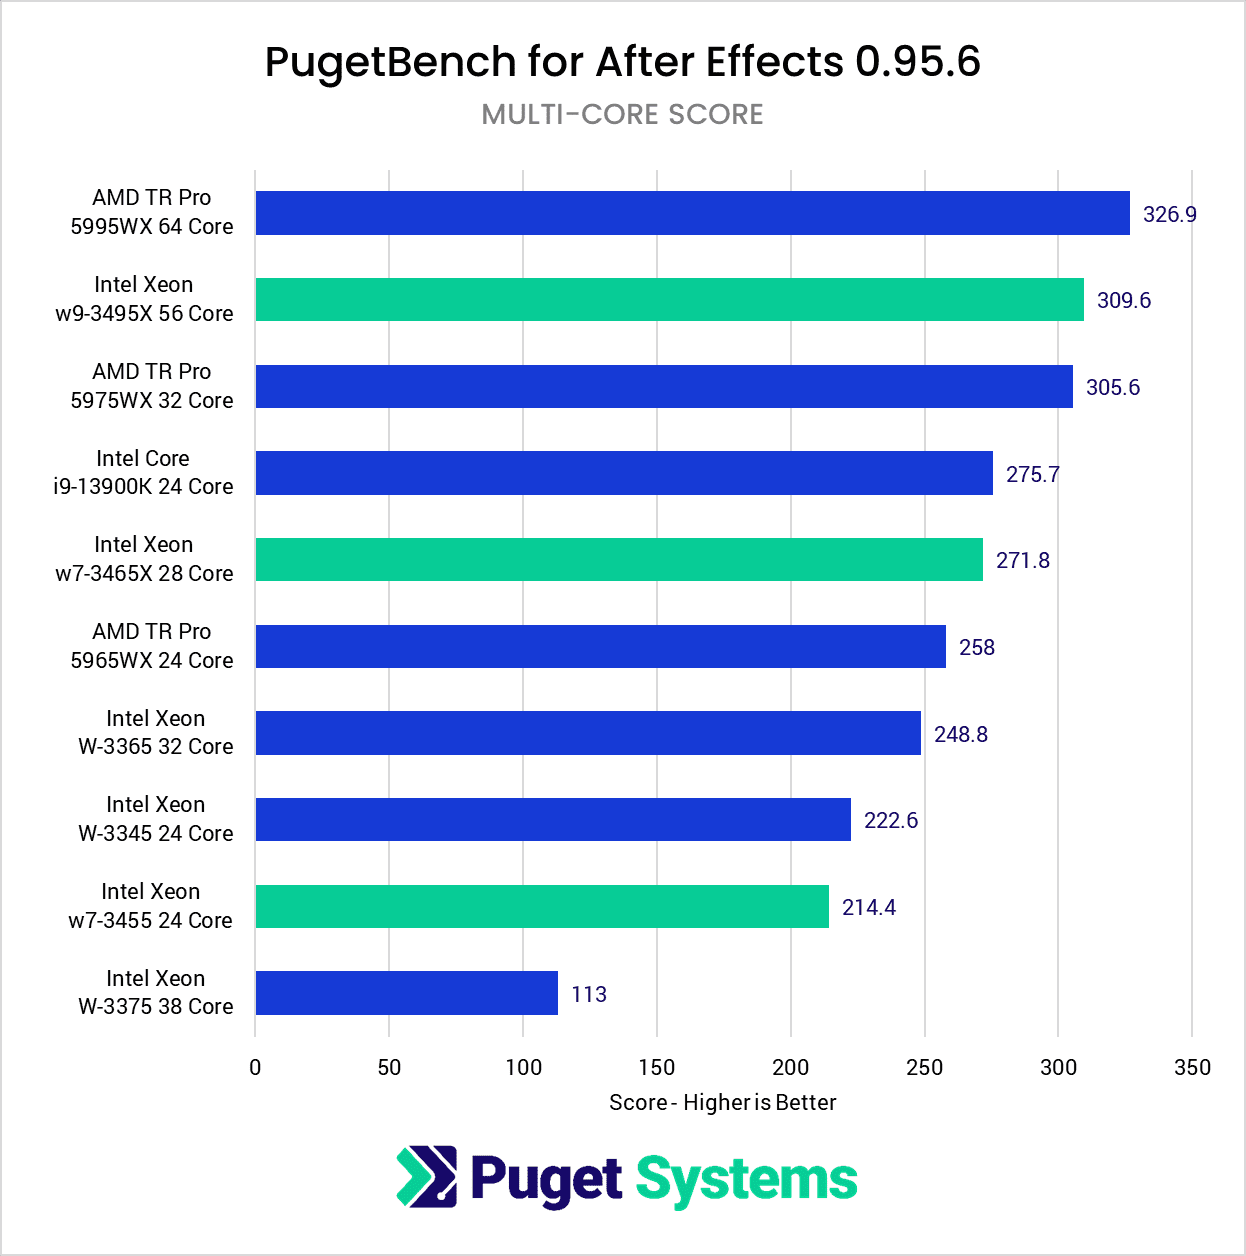
You can see performance for MFR optimized projects in chart #2, and here, the new Xeons do well. The w9-3465X 28 Core is 10% faster than the previous generation W-3365 32 Core, and the w9-3495X 56 Core is 24% faster than anything from the previous generation. AMD still has a slight lead in most cases, but we will have to wait to see how this changes with Intel’s ongoing optimization work.
Graphic Design: Photoshop
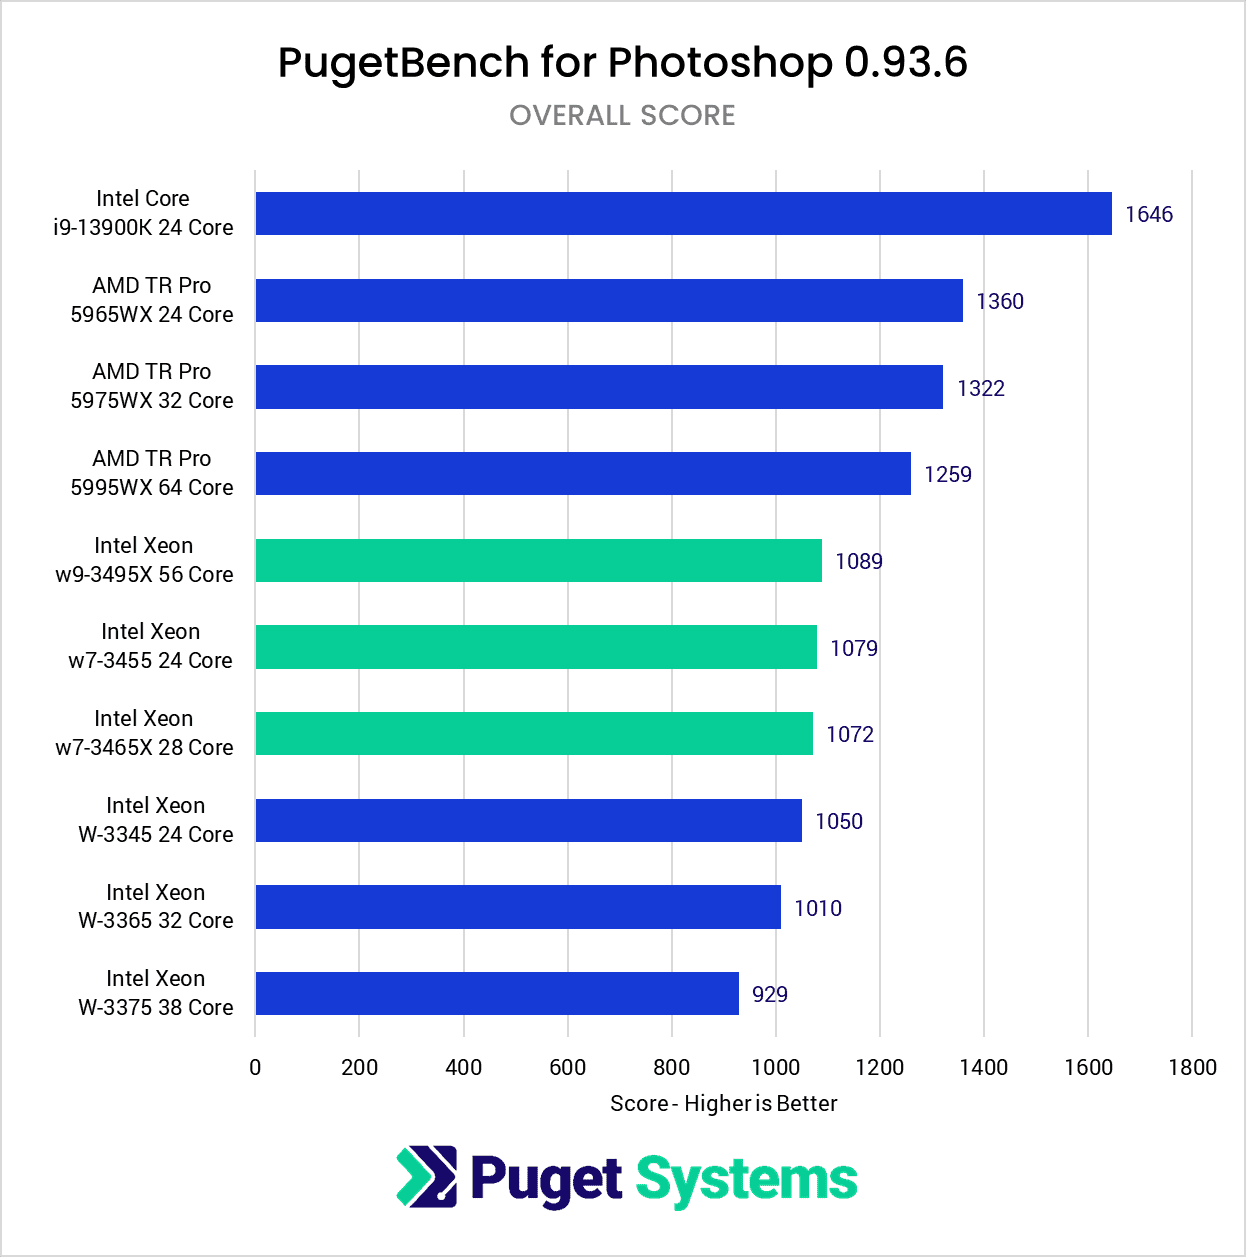
Photoshop is unlikely to be a primary application for anyone looking at this class of processor, but it is extremely common as a secondary app. The reason behind this should be somewhat obvious from how much faster a CPU like the Intel Core i9 13900K is than any Xeon or Threadripper PRO CPUs we tested. Outside of niche workflows that need more than 128GB of RAM, you can save a ton of money and get much higher performance with an Intel Core processor. Because of this, we often include Photoshop more to check for any major issues, rather than determining which CPU is necessarily the fastest.
And in that sense, the new Xeons are fine, but not significantly better than the previous generation, and a good amount behind AMD. What is a bit odd is that since Photoshop is a very lightly threaded application, we would expect the gen-over-gen performance gain to be much higher. Intel themselves state a 28% speedup in these kinds of workflows, and our own Cinebench single-threaded results later in this article showed that these CPUs should do much better than we are seeing.
But again, there is still a lot of work being done on these processors, and it will be interesting to see how this changes as we get closer to the sales embargo date. It is also entirely possible that this isn’t something Intel can address directly, and has more to do with Adobe’s underlying code than anything else.
Game Dev/Virtual Production: Unreal Engine
Unreal Engine has a wide variety of uses, including game development, virtual production, and realtime visualization. Most of the heavy lifting in Unreal Engine is GPU bound, but every user will deal with tasks like compiling shaders which is performed purely on the CPU. Due to time constraints and the fact that this is an early preview of these CPUs, we did not test compiling the source code in Visual Studio but limited the testing to what happens within Unreal Engine.
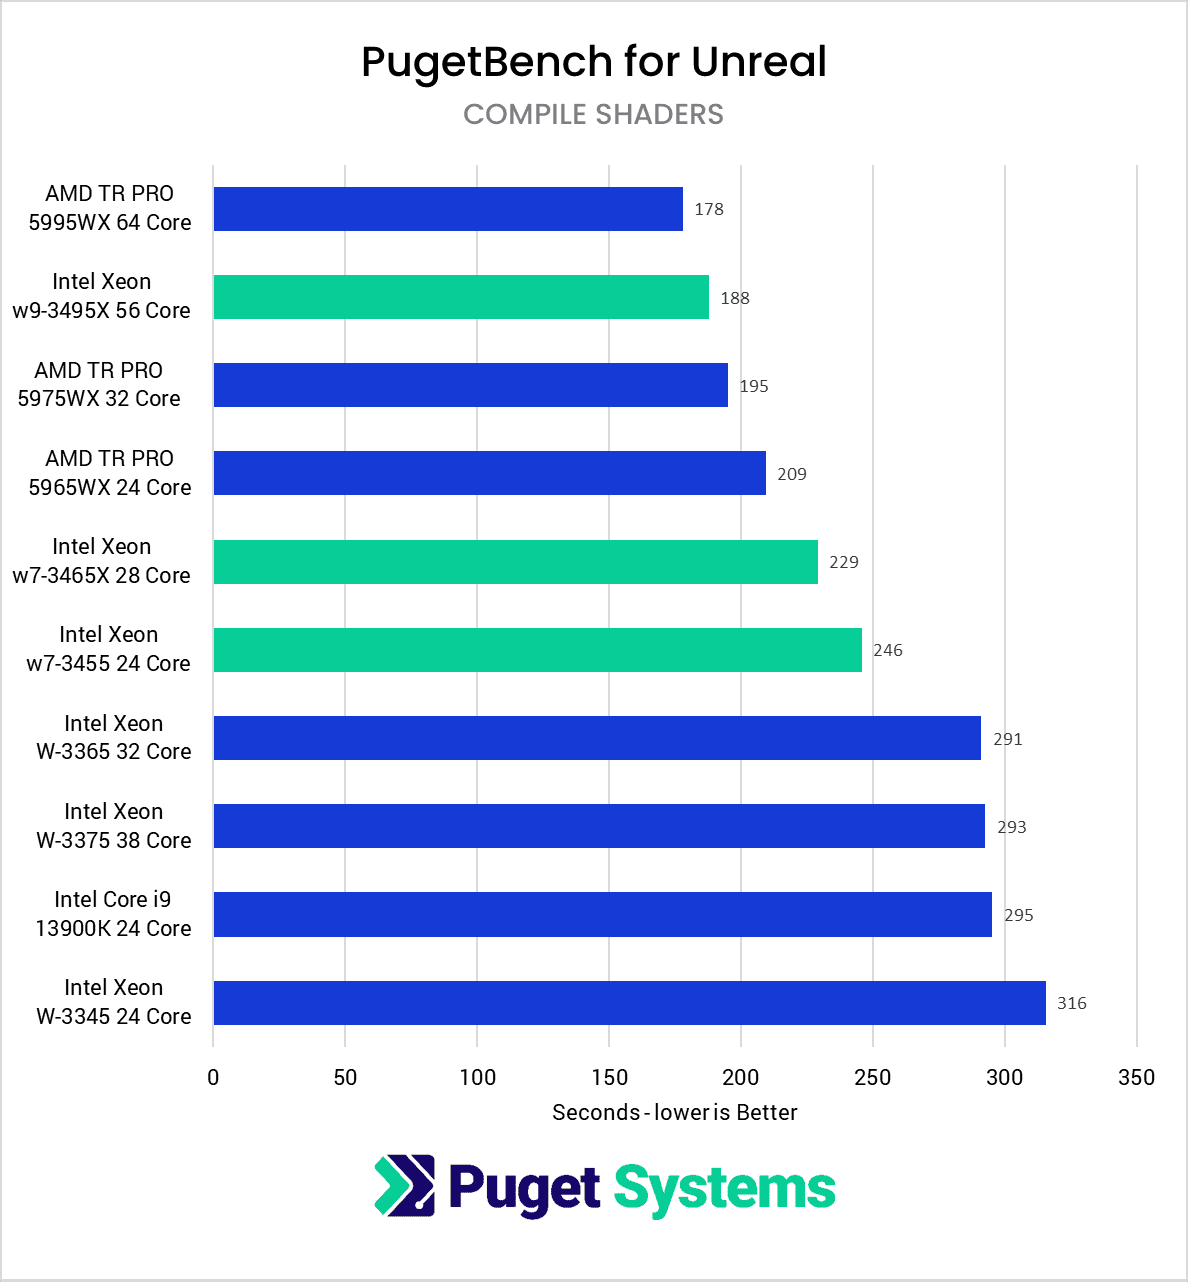
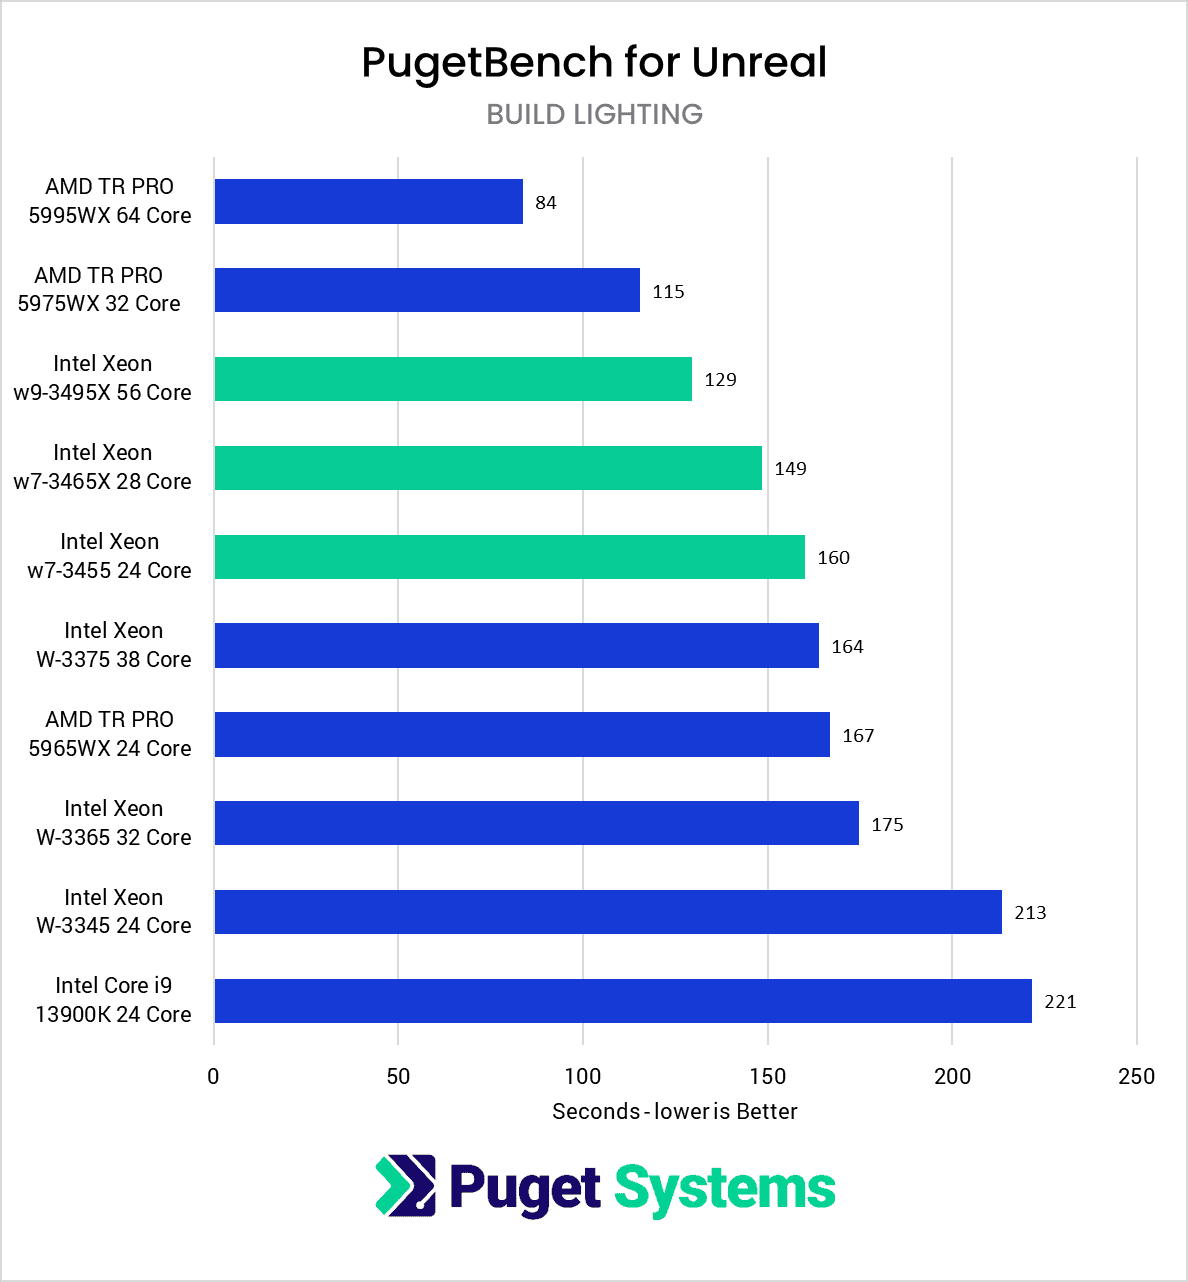
Starting with the top of the new Xeon CPUs, the w9-3495X is about 6% slower than the Threadripper Pro 5995WX in shader compilation. This is a task that every user deals with to some extent, and 6% difference is a very decent showing for a CPU with eight fewer cores. However, things are quite different when it comes to light baking. Here the new Intel is quite a bit slower than AMD’s offerings. It even comes in slower than the 32 core Threadripper. This task is mainly limited to game development, as virtual production will likely use Ray Tracing or GPU Lightmass. Hopefully, this is something that future BIOS updates will help with.
Moving down to the 28 core Xeon w7-3465X, it is about 17% slower than the 32-core Threadripper 5975WX in the shader compilation test, which makes it fairly close on a per-core basis. However, much like the w9-3495X, the light building performance is lacking, being 30% slower than the Threadripper.
Lastly, the 24-core Xeon w7-3455 is 18% slower than the similar core count Threadripper 5965WX in shader compilation. This is a fairly disappointing result, especially when we saw the two CPUs nearly on par for the CPU rendering tests in the following sections. Interestingly, the Xeon pulls a slight win in light building. There is only a 4% difference between Intel and AMD, but it is a win nonetheless.
CPU Rendering: Cinebench
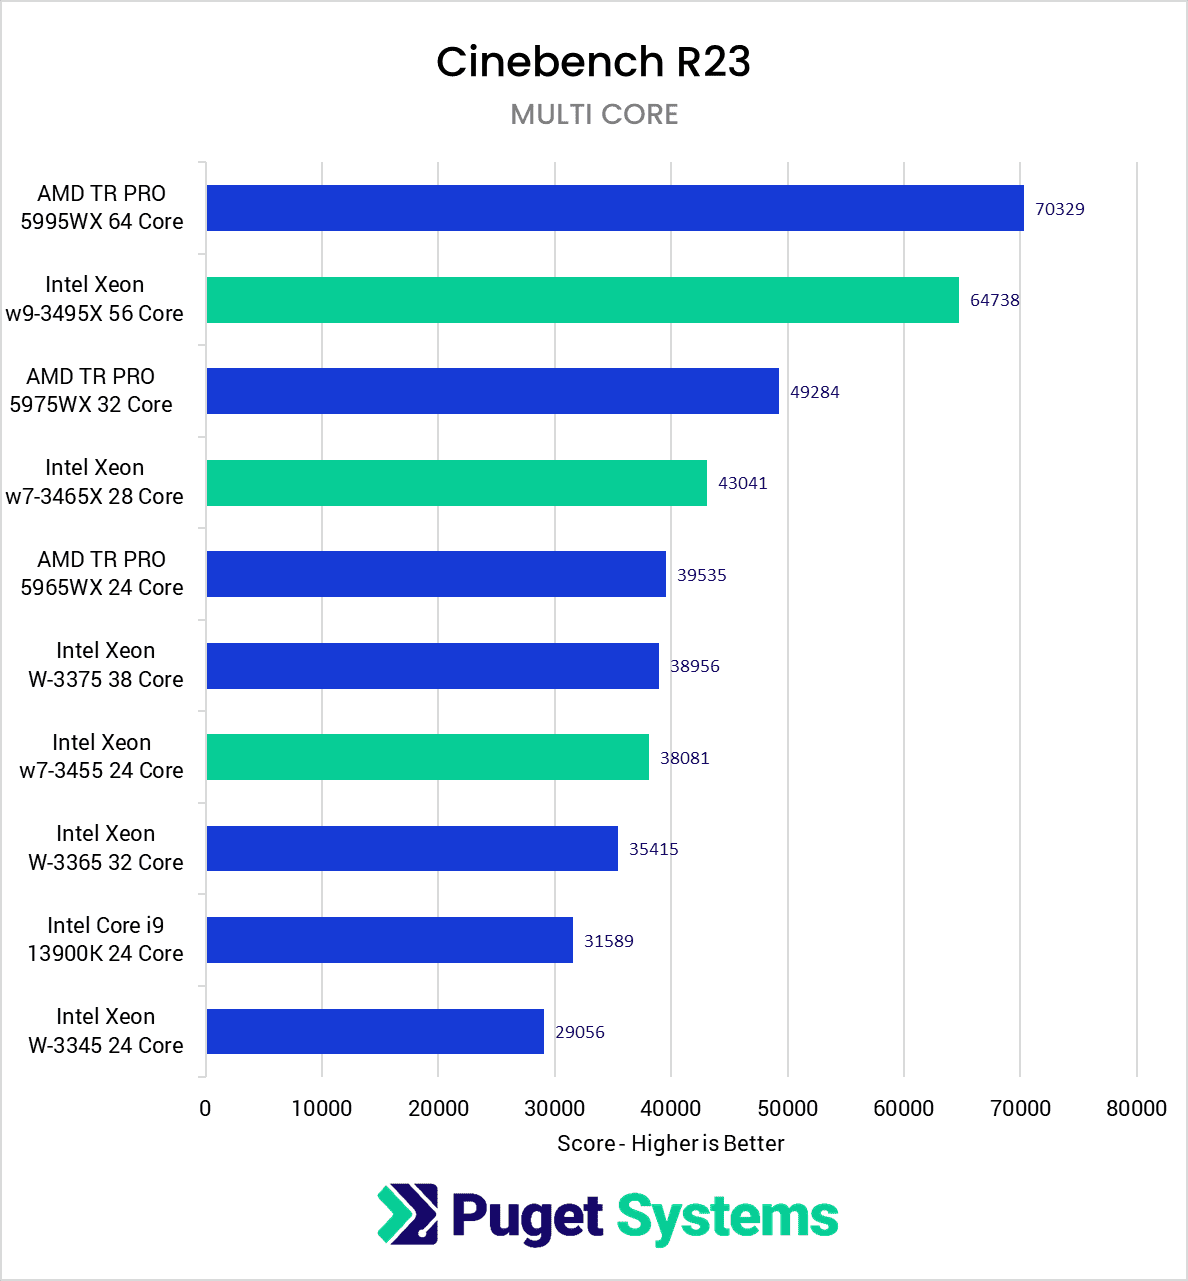
Moving on to CPU rendering, this is where CPUs with high core counts dominate. AMD has had a lead here for quite some time with their 64 core Threadripper Pro 5995WX, but Intel’s new 56 core Xeon w9-3495X aims to close the gap. In the Cinebench R23 benchmark from Maxon, the Xeon does come close with a score of 64738, compared to the 64 core Threadripper score of 70329. On a points-per-core basis, these two CPUs are very similar. We’ll see if things change with future BIOS updates before the official launch.
This continues down the stack with the 28 core Xeon w7-3465 scoring 43041. There isn’t a 28-core Threadripper, so comparing it to the 32 core Threadripper Pro 5975WX is the closest match. Again, AMD is faster overall, but comparing performance per core, they are close. When looking at the previous generation, we can compare it to the 32 core W-3365, where the new CPU manages 20% faster performance with eight fewer cores.
The Intel Xeon w7-3455 24 core provides the most direct comparison with AMD, as the Threadripper Pro 5965WX also has 24 cores. Here we see that AMD is just shy of 5% faster, showing that Intel has largely caught up to AMD for CPU rendering performance. The previous generation Xeon also had a 24 core CPU, the W-3345. With this comparison, we see a 30% improvement in performance over the previous generation.
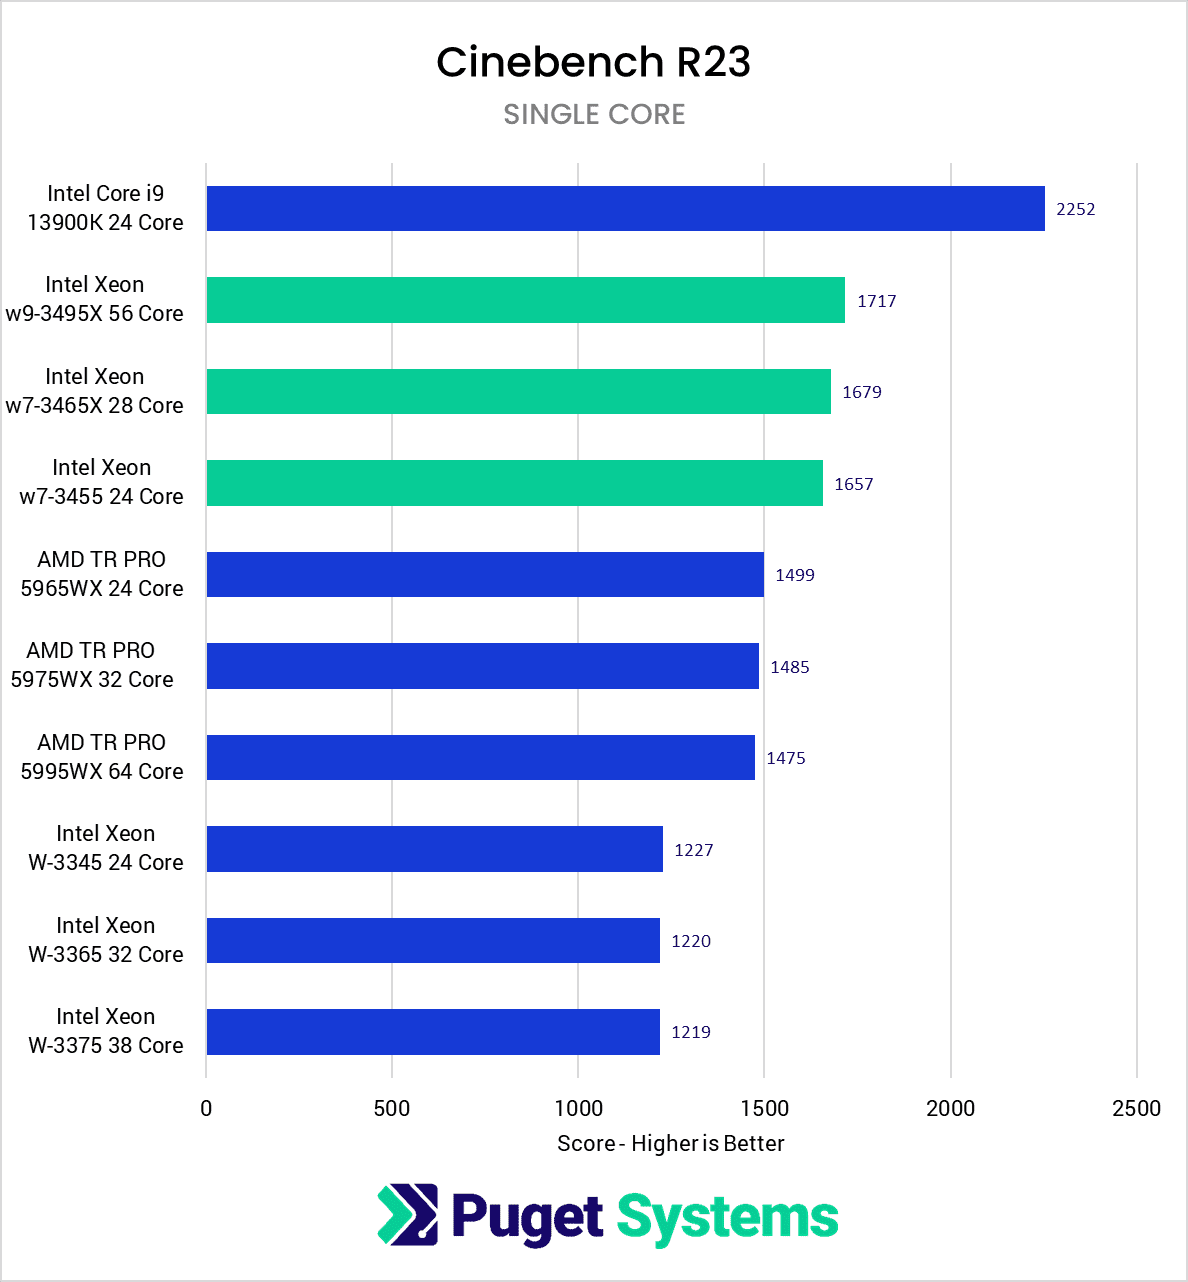
If we look at the single-core results, things are a little more straightforward as each CPU within a given family has similar single-core performance. The new Xeons are roughly 15% faster than the Threadrippers and 40% faster than the previous generation Xeons. This actually greatly exceeds Intel’s claims of a 28% gen-over-gen gain in single-threaded performance, and is one of the strongest results for Intel we saw throughout our testing.
CPU Rendering: V-Ray
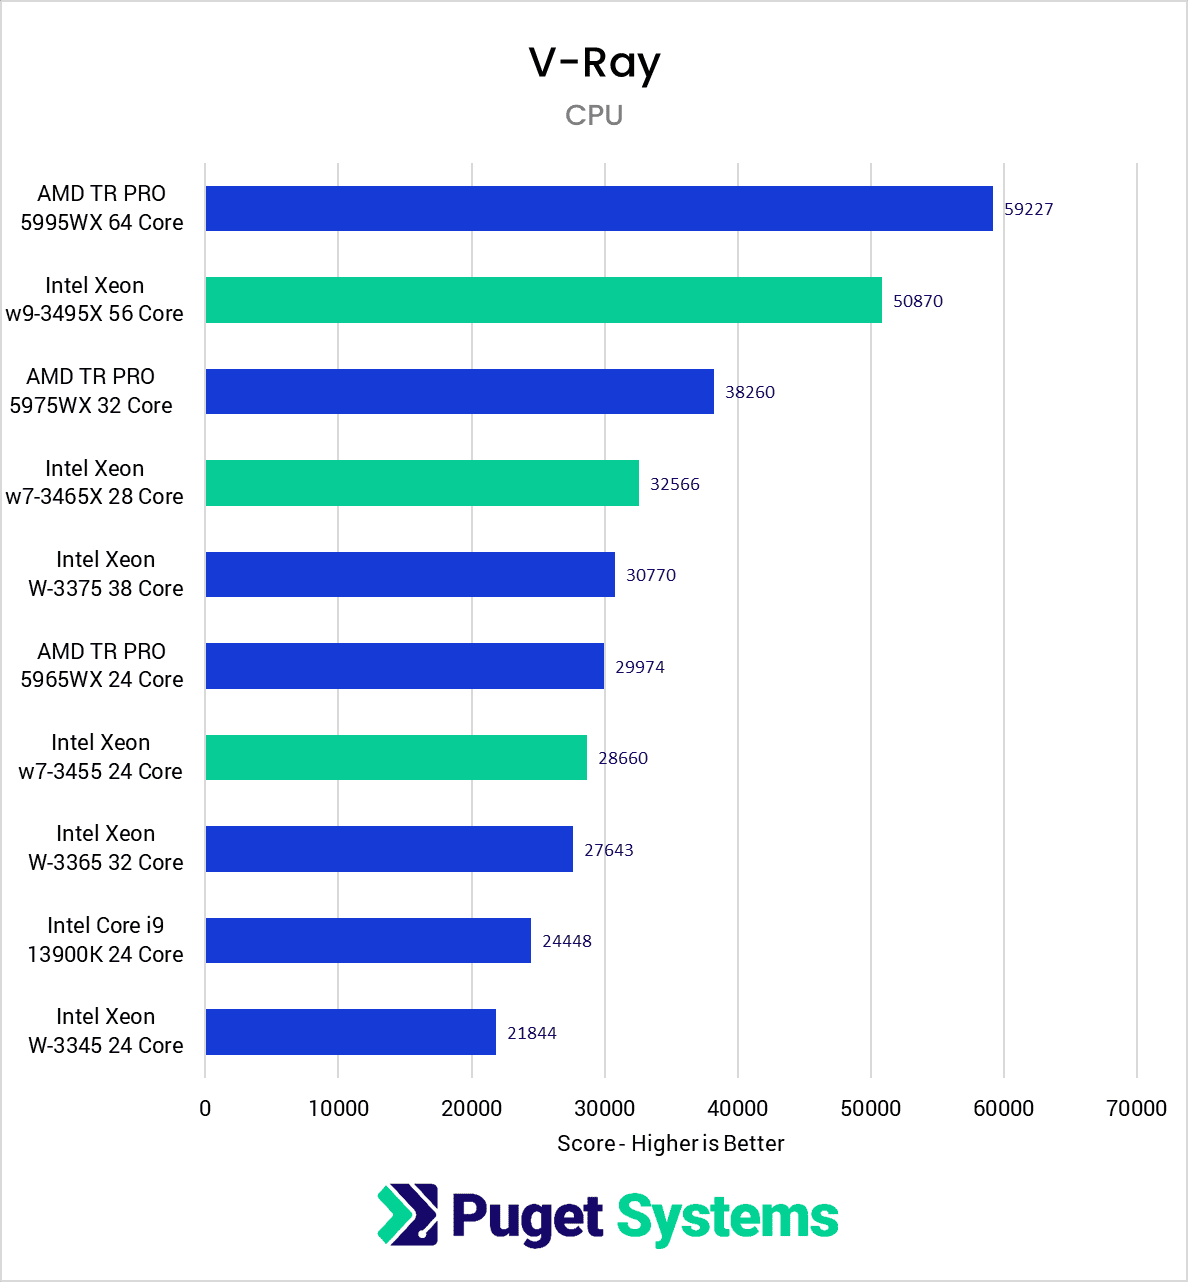
In V-Ray from Chaos, we see results that mirror that of Cinebench. The Xeon w9-3495X is 15% slower than the Threadripper 5995WX but also has roughly 15% fewer cores. We see the same with the w7-3465X. It, too, is 15% slower than the Threadripper 5975WX with 15% fewer cores.
Moving down the trio of 24-core CPUs, the new Xeon w7-3455 is within 5% of the Threadripper and 30% faster than the previous generation Xeon W-2245. Again, these are very welcome improvements, bringing Intel in line with their competition.
CPU Rendering: Blender
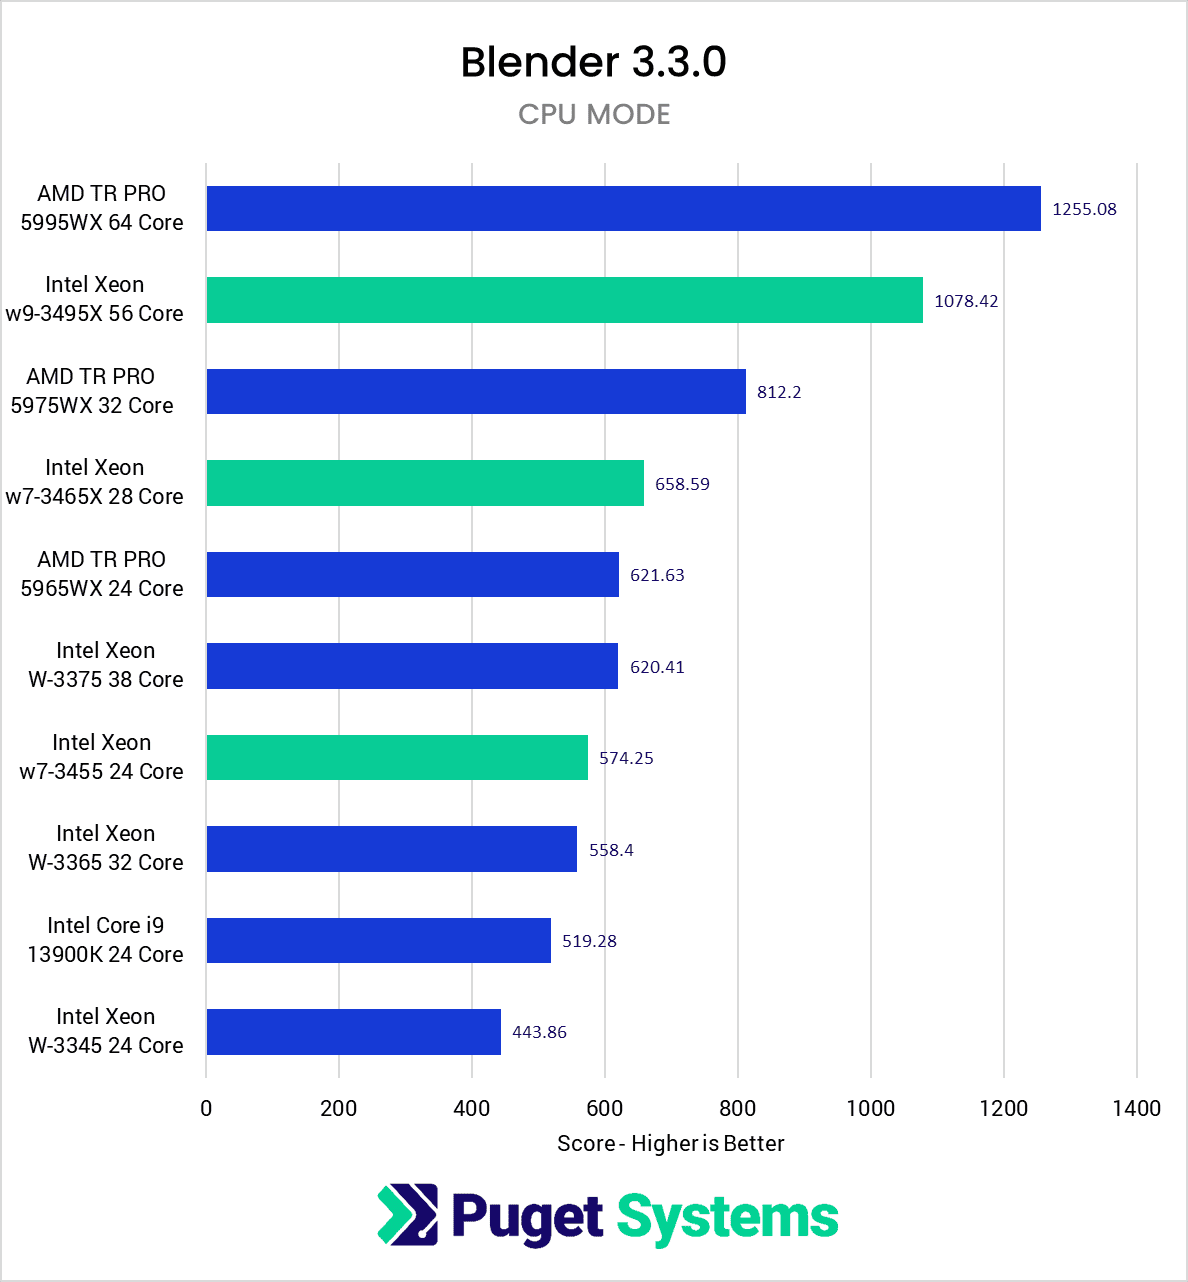
Blender is our final CPU render test. Most Blender users are migrating to GPU rendering, but there are still some cases where CPU is preferred. Just as we saw in the other rendering benchmarks, the 56-core w9-3495X is 15% slower than AMD’s top offering, the 64-core Threadripper Pro 5995WX. There is a 15% difference in the number of cores, so the two CPUs are roughly equal in per-core performance. Moving on to the 28-core w7-3465X, AMD’s 5975WX lead grows slightly to 19%, but that still leaves the two very close on a per-core comparison.
The Xeon w7-3455 comes in 8% slower than the Threadripper Pro 5965WX, both with 24 cores. AMD still holds the lead and is a bit stronger in Blender than the other renderers. Just as we saw with V-Ray, the new Xeon’s are 30% faster than the previous generation.
How Well Do the Intel Xeon W-3400 Processors Perform for Content Creation?
In truth, we don’t feel we can make any firm claims about how good the new Xeon W-3400 processors are for content creation at this time. The public is rarely given access to third party performance information this far ahead of being able to get the product, so we again want to stress that we completely expect things to improve over the next few months. We were being sent BIOS updates right up until the publication of this post, so even these results are likely to be out of date already. How much performance will change between now and March for the W-2400 series, and April for the W-3400 series, is completely unknown.
What we can do, however, is talk a bit about where Intel is already doing well with their new W-3400 processors, and where we hope they will focus their optimization efforts. In general, heavily-threaded workloads like CPU rendering is looking good, with Intel being largely on par with AMD’s Threadripper PRO line. We are sure Intel would like to take a firm lead for these tasks, however, so we expect at least some optimizations to come even here.
Lightly threaded tasks are the biggest problem area for Intel at the moment, although it is interesting to see the duality between straight-forward workloads like the Cinebench single threaded benchmark, and more complex ones like Photoshop. The Xeon W-3400 did amazing in Cinebench with a 40% gen-over-gen performance gain, putting them on top of AMD by about 15%. On the other hand, Photoshop was only barely faster than the previous generation, and well behind AMD. This begs the question of whether it is Intel who needs to be doing optimizations for these applications, or if it is more on Adobe to update their application code.
While this post has been an interesting preview of the new Xeon processors, there is still a TON of testing we want to do. The optimizations Intel is working on is of course at the top, but there are several other topics we are highly interested in. This includes testing the W-2400 processors, investigating what cooling these processors need, and looking at performance for multi-GPU workflows.
Overall, we are very excited about these new Intel Xeon processors. Unlike the general public, we regularly have the opportunity to see how performance changes in the weeks and months leading up to a launch, so these results are not as concerning to us as they may be for most of our readers. While it would be great if everything were perfectly optimized this far in advance, reality is often very different. It will be very interesting to compare performance over the next few months to these early initial testing results!
If you are looking for a workstation for any of the applications we tested, you can visit our solutions page to view our recommended workstations for various software packages, our custom configuration page, or contact one of our technology consultants for help configuring a workstation that meets the specific needs of your unique workflow.


