Table of Contents
Introduction
In what is the first non-mobile CPUs to use Intel’s new (and not-improved) branding, Intel has released its Core Ultra Desktop Processors 200S Series, formerly codenamed Arrow Lake and alternatively known as Intel Core Ultra Desktop Processors (“Series 2”). These are the first desktop CPUs utilizing the new “Core Ultra” naming scheme, which is a departure from the popular Core i3/i5/i7/i9 naming most people are used to. Naming changes aside, these processors represent a noticeable shift in Intel’s strategy around its CPUs to focus on efficiency and set the stage for future processor designs—a strategy that will seem familiar to those who followed AMD’s Ryzen 9000 launch a few months back.
At launch, Intel has released the Core Ultra 9 285K, Core Ultra 7 265K/KF, and Core Ultra 5 245K/KF, with H and HX mobile chips announced for Q1 2025. This represents a slightly smaller stack than is typical, notably missing a KF (“F” representing processors without an integrated GPU) at the Core 9 (i9) level, as well as any non-K (“K” represents being unlocked for overclocking/higher power limits) processors. We’ll see if they announce these in the coming months, or if they decide to include a 285KS-type CPU which are typically better binned and slightly higher clocked, typically intended for overclockers.

Arrow Lake, unlike many previous desktop architectures, feels primarily inspired by the last-generation Meteor Lake mobile architecture. On a large scale, this is the first desktop processor utilizing Intel’s Foveros technology, allowing them to combine chiplets together rather than produce a singular, monolithic die. Much like it does for AMD, this allows Intel to utilize the increased production efficiency of chiplets.
In terms of the microarchitecture, Intel has moved on from the Raptor Cove P-cores and Gracemont E-cores of 13th and 14th Gen to the new Lion Cove and Skymont P- and E-cores, respectively. Lion Cove promises a 9% IPC uplift over Raptor Cove and, for the first time in a mainline desktop processor since Nehalem, doesn’t feature Hyper-Threading capabilities. It has an additional 1 MB L2 Cache per core (up from 2 MB) and a reworked cache hierarchy and scheduler. On the E-core side, Intel claims a 32% IPC uplift for Skymont over Gracemont. If you want more of a dive into the microarchitecture, we recommend Chips and Cheese‘s (detailed) overview of Lion Cove and Skymont.
Other notable changes are an improved iGPU and the inclusion of an NPU (Neural Processing Unit). An NPU can theoretically be leveraged, much like an iGPU or media accelerator, to offload specialized AI work (e.g., image enhancement/stabilization in Zoom) from the CPU cores, increasing performance and efficiency. The included NPU is NPU 3, the same that featured on last-gen Meteor Lake, as opposed to Intel’s NPU4 on the current-gen Lunar Lake laptops. At the moment, there are not many desktop applications that can utilize the NPU, and it will be interesting to see what apps develop support for the NPU in the coming months and years.
Below, we have listed the most relevant CPU specifications from AMD and Intel. For more information, visit Intel Ark or AMD’s Ryzen page.
| CPU Model | MSRP | Cores (Threads) | Maximum Boost Clock | Maximum Power* | Release Date |
|---|---|---|---|---|---|
| AMD Ryzen 9 9950X | $650 | 16 (32) | 5.7 GHz | ~199 W | Aug. 2024 |
| Intel Core Ultra 9 285K | $590 | 8P + 16E (24) | 5.7 GHz | 250 W | Oct. 2024 |
| Intel Core i9-14900K | $590 | 8P + 16E (32) | 6 GHz | 253 W | Oct. 2023 |
| AMD Ryzen 9 9900X | $500 | 12 (24) | 5.6 GHz | ~156 W | Aug. 2024 |
| Intel Core i7-14700K | $410 | 8P + 12E (28) | 5.6 GHz | 253 W | Oct. 2023 |
| Intel Core Ultra 7 265K | $394 | 8P + 12E (20) | 5.5 GHz | 250 W | Oct. 2024 |
| AMD Ryzen 7 9700X | $360 | 8 (16) | 5.5 GHz | ~87 W | Aug. 2024 |
| Intel Core Ultra 5 245K | $320 | 6P + 8E (14) | 5.2 GHz | 159 W | Oct. 2024 |
| Intel Core i5-14600K | $320 | 6P + 8E (20) | 5.3 GHz | 181 W | Oct. 2023 |
| AMD Ryzen 5 9600X | $280 | 6 (12) | 5.4 GHz | ~87 W | Aug. 2024 |
Regarding top-line specifications, Intel has maintained the same general capabilities as the last generation Raptor Lake parts. At a given tier, Intel has maintained core counts and distributions, although with fewer threads due to the removal of Hyper-Threading. We also see a minor drop in frequency—apparently, Lion Cove does not clock as high as the mature Raptor Cove cores. However, on the E-core side, we actually see an increase of base and boost frequencies of 2.4 and 4.4 GHz, respectively, to 3.2 and 4.6 GHz, respectively.
Intel has also slightly tweaked the power limits for the processors, with the old 14th Gen capping out at 253 W and Core Ultra 200S series at 250 W, for the Core 9 / i9s and Core 7s / i7s. Similarly, the Core 5 has dropped to 159 W from the i5’s 181 W. These are small enough changes in power that they are likely irrelevant for most users, but Intel does claim that the power draw in moderate and light loads should be significantly down. Somewhat confusingly, despite only recommending that PL1 = PL2, Intel continues to officially list these processors as 125 W parts. This has been a trend from both Intel and AMD to not report accurate and relevant TDP numbers in the specs of their processors, which is why we have largely swapped to reporting the maximum power recorded in our testing instead.
Price-wise, the Intel Core Ultra 200S drops in at nearly the same price as Intel 14th Gen (save for the Ultra 7, at about $15 cheaper). This positions them slightly above AMD on the lower end, although the 285K is right in between the Ryzen 9900X and 9950X. AMD likes to put their processors on sale, though, so retail prices may vary from the MSRP shown above.
Test Setup
Intel Core Ultra Test Platform
| CPUs: Intel Core Ultra 9 285K Intel Core Ultra 7 265K Intel Core Ultra 5 245K |
| CPU Cooler: Noctua NH-U12A |
| Motherboard: Gigabyte Z890 Aorus Pro Ice BIOS version: F9b |
| RAM: 2x G.SKILL Trident Z5 DDR5-6400 32GB (64 GB total) Running at 6400 Mbps |
| GPU: NVIDIA GeForce RTX™ 4080 16GB Driver Version: Studio 565.90 |
| PSU: Super Flower LEADEX Platinum 1600W |
| Storage: Samsung 980 Pro 2TB |
| OS: Windows 11 Pro 64-bit (26100) Power Profile: High Performance |
Intel Core 14th Gen Test Platform
| CPUs: Intel Core i9-14900K Intel Core i7-14700K Intel Core i5-14600K |
| CPU Cooler: Noctua NH-U12A |
| Motherboard: ASUS ProArt Z690-Creator WiFi BIOS version: 3901 |
| RAM: 2x DDR5-5600 32GB (64 GB total) Running at 5600 Mbps |
| GPU: NVIDIA GeForce RTX™ 4080 16GB Driver Version: Studio 565.90 |
| PSU: Super Flower LEADEX Platinum 1600W |
| Storage: Samsung 980 Pro 2TB |
| OS: Windows 11 Pro 64-bit (26100) Power Profile: Balanced |
AMD Ryzen Test Platform
| CPUs: AMD Ryzen 9 9950X AMD Ryzen 9 9900X AMD Ryzen 7 9700X AMD Ryzen 5 9600X |
| CPU Cooler: Noctua NH-U12A |
| Motherboard: ASUS ProArt X670E-Creator WiFi BIOS Version: 2403 AGESA v Combo AM5 PI 1.2.0.2 |
| RAM: 2x DDR5-5600 32GB (64 GB total) Running at 5600 Mbps for Ryzen 9000 |
| GPU: NVIDIA GeForce RTX™ 4080 16GB Driver Version: Studio 565.90 |
| PSU: Super Flower LEADEX Platinum 1600W |
| Storage: Samsung 980 Pro 2TB |
| OS: Windows 11 Pro 64-bit (26100) Power Profile: Balanced |
Benchmark Software
| Photoshop 25.12 – PugetBench for Photoshop 1.0.1 |
| Premiere Pro 24.6.3 – PugetBench for Premiere Pro 1.0.2 |
| After Effects 24.6.3 – PugetBench for After Effects 0.96 |
| DaVinci Resolve 19.0.2.7 – PugetBench for DaVinci Resolve 1.1.0 |
| Cinebench 2024 |
| Blender 4.0.0 |
| V-Ray 6.00.01 |
| Unreal Engine 5.3 |
Due to an issue with our 9600X sample, we were unable to re-test the processor for this review. Instead, we pulled results from our AMD Ryzen 9000 Content Creation Review. There have been a number of driver, OS, and BIOS updates since then so, although we expect the results to be similar, the reported Ryzen 9600X results are likely a few percent lower than if we were to test them now.
As is typical, we tested the new processors against the current enthusiast-class desktop processors from both manufacturers: Intel Core 14th Gen and AMD Ryzen 9000 series. We do this because it allows us to compare the former CPUs and investigate generational changes, while the latter allows us to see how the new processors compare to the current competition.
For this review, power settings are a bit more complicated than normal. Our typical stance is to run CPUs within official specifications and at settings that we view as appropriate for professional workstations. This means that we usually run memory at the maximum supported JEDEC frequency, disable overclocking features, and use the Windows “Balanced” power profile.
For Intel 14th Gen, all of our results were collected using the “Intel Performance Profile” in our BIOS, with JEDEC RAM at 5600 Mbps and with ASUS MCE and Intel ABT disabled. This is not how we currently ship our systems (due to the elevated PL1 = 253 W), but it gives the most fair comparison to the older generation of CPUs—it is also Intel’s “default” recommendation. We also tested a 14900K configured as we currently ship systems, with PL1 = 125 W. The lower PL1 is permitted within Intel’s “Performance” specification. All of these results were collected while using the “Balanced” Windows power profile.
For AMD’s Ryzen 9000 series processors, we similarly ran with overclocking features like MCE and ASUS Medium Load Boostit disabled and AMD’s PBO disabled. Memory was run at JEDEC 5600 Mbps, and we used the Windows “Balanced” power profile.
For Intel Core Ultra (“Series 2”), we selected the “Intel Performance Profile” in the BIOS. As Intel no longer lists a lowered PL1 = 125 W as part of the “Performance” specification, we left PL1 = 250 W. We used a kit of 6400 XMP memory with timings set to JEDEC specifications to approximate the performance from the 6400 Mbps CUDIMMs these processors support, though we plan on investigating memory scaling in the future. We also used the Windows “High Performance” power plan, as we noticed a large discrepancy in performance in some workloads. We will cover this more in an upcoming power article, but typically, for 14th Gen and older Intel CPUs, the performance difference is 0-1%, whereas, for the 200S CPUs, it was 5-15%.
To test the processors, we used a variety of industry-standard benchmarks, including our own PugetBench benchmarks, Cinebench 2024, V-Ray, and Blender. These give us targeted, real-world performance numbers for a variety of content creation applications and help inform us about the components’ performance in other uses.
Graphic Design: Adobe Photoshop
In our PugetBench for Adobe Photoshop benchmark, the new Intel 200S processors show no real gain in performance over the previous generation. The Overall Score (Chart #1) is within the margin of error between them and the last-gen Intel processors, leaving them behind AMD’s Ryzen 9000 processors. Specifically, the 9600X, 9900X, and 9950X lead the Ultra 9 285K by 10%, and the 9700X is 17% ahead of the 285K. The only area where we see any improvement is on the very low end, with the Ultra 5 245K leading the i5-14600K by 5%.
Overall, this is slightly better than Intel’s own performance numbers published during their official launch a few weeks ago, where they advertised a small performance loss in this benchmark from the last generation. Stagnated performance is never good, but it is certainly better than performance regression and is only a piece of the puzzle this time around in combination with the supposed lower power draw (which we will examine in an upcoming article).
Nonetheless, the clear winner in Adobe Photoshop is AMD, with all of their processors out-performing all the new Intel Core Ultra desktop CPUs.
Video Editing: Adobe Premiere Pro
Premiere Pro is an application that has historically favored Intel due in large part to the media accelerators included in the iGPU and enabled via QuickSync. In our results, this is seen in the LongGOP (Interframe) score. Otherwise, Premiere has a mix of single- and multi-threaded CPU tasks, as well as GPU-based tasks.
The 285K establishes leadership across the board, with a 5% uplift over the 14900K in Overall Score. Intraframe and RAW scores see little gain, but we see a much larger 13% performance increase for LongGOP codecs. This puts the Core Ultra 9 10% ahead of the best AMD CPU, the 9950X, except for in the GPU effects, where the AMD processor is able to eek out a small advantage.
Directly behind the 285K in terms of performance is the Ultra 7 265K, which also sees gen-on-gen performance increases of about 5%. This does let it beat out the 9950X and positions it 9% ahead of the 9900X overall, and 18% ahead of the 9700X. This barely trailing position behind the 285K continues through most of the subtests, making the CPU competent across the board. Managing to catch and, in some cases beat, the last-gen Core i9 is impressive, though somewhat tempered by the relatively small differences between Intel CPUs overall.
Finally, the 245K takes up a position in the middle of the pack, behind all the other Intel CPUs save for last generation’s 14600K (which it leads by 8%) but ahead of every AMD CPU except the 9950X (which it is 1% behind). However, the Core Ultra 5 part has much more differentiation between subscores, with great LongGOP scores due to the iGPU, but much weaker Intraframe and RAW scores. If you aren’t using a codec that can be accelerated via QuickSync, the 245K is a much more dubious proposition compared to some of AMD’s lower end processors.
Overall, Premiere Pro remains an area of strength for Intel, and one where the new processors do manage to have acceptable gen-on-gen performance gains. Although relatively small (~5%), it does move every SKU effectively up a tier in terms of performance compared to the last generation. Nonetheless, we hope that Intel manages larger performance uplifts in other applications.
Motion Graphics: Adobe After Effects
When we reviewed AMD’s launch of their Ryzen 9000 series of processors, they very nearly took the performance lead in After Effects from Intel, even though they only averaged a performance uplift of about 5%. However, since then, there have been a number of changes that have affected both AMD in a slightly positive way (Windows branch prediction updates), and Intel in a slightly negative way (microcode updates). Because of this, AMD is actually now ahead of Intel’s previous Core 14th Gen processors but about 4%. However, Intel’s Core Ultra 200S series processors give a decent performance increase over the 14th Gen processors, allowing Intel to once again establish the lead in After Effects.
Across every subscore—and the Overall Score—the 285K is the top-performing CPU in After Effects. In the Overall Score (Chart #1), it has a 10% performance lead over AMD’s 9950X and 15% over the 9900X. This makes it 14% faster than the last-gen 14900K (at 253 W, though power settings make little difference in most tests). Although not the largest gain, the Multi-Core Score (Chart #2), which tests extremely large and complex projects, is probably the most impressive part, as the 285K manages to out-muscle the additional threads of the 9950X.
The 265K, on the other hand, slots in at rough performance parity with both the 14900K and 14700K, with little gen-on-gen performance gain. In most categories, the 265K is somewhat ahead of the 14700K, but surprisingly, it falls behind in multi-core performance in After Effects, dragging the Overall Score down. It does end up with a 5% lead over the 9700X, but we’re generally unimpressed with the Core Ultra 7 in this application.
Finally, the Ultra 5 245K scores 9% higher overall than the 14600K, giving it a similar lead over the slightly cheaper 9600X and performance parity with the more expensive 9700X. This positions it 5% behind the 265K, but that isn’t evenly distributed. The 265K is 25% faster in our multi-core test using Adobe’s MFR feature but closer to 5% in most of the other tests. This positions the 245K as the best budget CPU for After Effects, with the step up to the 265K only really necessary for multi-core performance and the 285K for performance leadership.
Video Editing / Motion Graphics: DaVinci Resolve Studio
Moving on to DaVinci Resolve, the new Core Ultra 200S series is not significantly faster than the previous generation Intel processors, although part of this is because significant portions of Resolve are heavily GPU-accelerated, so raw CPU performance doesn’t show up as much in the overall score. The 285K is 1% ahead of the 14900K (and, oddly, 1% behind the 14700K), but that is well with our standard margin of error. This also makes it a touch slower than the 9950X, though which of those is best depends a bit on workflow. Like Premiere Pro, Intel is superior in LongGOP Quick Sync accelerated workflows and Intraframe workflows, while AMD wins in RAW workflows (and, less importantly, in AI and GPU-based Effects).
Intel’s Core Ultra 265K is very disappointing in this benchmark, scoring 5% below the 14700K. This does still put it on parity with the more expensive 9900X and 7% ahead of the comparable 9700X, but the 14700K is more performant and can likely be had for cheaper. However, it is important to look at where the discrepancy is happening, and in most CPU-bound workflows (LongGOP, Intraframe, RAW) the 265K is on-par or slightly ahead of the 14700K. It falls behind primarily in Fusion, where the 14700K performs anomalously well. We are not sure if this is due to real performance differences or possibly some sort of early BIOS issue that will be resolved post-launch. Otherwise, the 265K is only behind in the GPU-heavy AI and GPU Effects scores.
The Core Ultra 5 part falls behind the 14600K, again largely due to Fusion performance. The 14600K also has an above-average LongGOP score in our testing here, but even for Intraframe codecs, the 245K’s best subscore, it is only barely ahead of the 14600K. In most cases, this still does leave it advantaged compared to the 9600X, with 6% higher performance overall, but we wouldn’t generally recommend the 245K over a 14600K for DaVinci Resolve.
Game Dev / Virtual Production: Unreal Engine
Our Unreal Engine benchmarks are some of the more temperamental ones we run, meaning it is often hard to draw great conclusions from them—we’ll definitely highlight a few areas where we don’t fully believe the results. Nonetheless, most users of Unreal Engine end up doing any number of the tested tasks at least occasionally, and the code compilation benchmark acts as a good proxy for many other code compilation tasks.
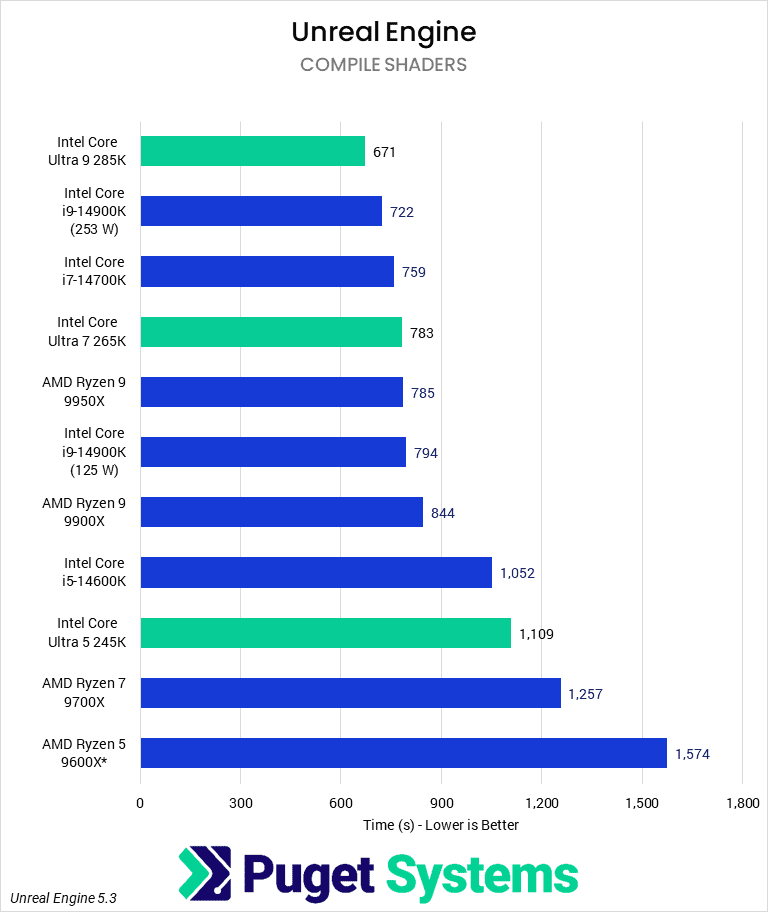
Compiling Shaders tends to be the most reliable of the portions of CPU-based Unreal Engine workflows we look at. In the Compiling Shaders task, the 285K completes the compilation in 7% less time than the 14900K and 15% less time than the 9950X. In the past, we have found this task to be particularly sensitive to memory frequency and CPU cache speed and amount, so we suspect that a portion of this is just the better RAM and cache from the Core Ultra 200S processor. The 265K actually ends up being somewhat slower than the 14700K, though, finishing in 15% more time, though still maintaining parity with the 9950X. The 245K is similarly unimpressive, with slight performance regressions.
Code compilation using Visual Studio also tends to be fairly consistent but with the occasional odd outlier (such as the 9700X in this round of testing). In this task, the 285K finished the compilation in 13% less time than the 14900K, which is tempered somewhat by the fact that (strangely) we found the 14700K to complete the compilation faster than the 14900K. Nonetheless, the Core Ultra processor handily beats the 9950X, and the 265K nearly catches it (although, again, still slower than the previous-gen 14700K). The 245K does relatively poorly, however, taking 10% longer to finish than the 14600K. Unfortunately, we don’t have any 9600X results for this benchmark at the moment due to our sample processor dying on us.
Light Baking frequently gives us the most trouble with the consistency of results of any of the three tasks, and we see that here with some odd outliers. In general, light baking tends to be AMD’s game to lose, with only the 285K managing to keep pace with the 9900X and 9950X, within a few percent either way. The next new Intel CPU to be featured on the chart is at the bottom with the 265K, taking 50% longer to complete the task than the 14700K or 9700X, while the 245K is closer to twice as long. Frankly, we don’t really trust that most of the Intel results are correct, but we would rather be transparent with that than hide potentially correct data. These odd results could be due to early motherboard BIOS, software bugs in Unreal Engine, or any other host of reasons.
Overall, the Intel CPUs do fine in Unreal Engine, with performance ranging from solid improvements to unbelievably (literally, we don’t believe it) horrible regressions. The 285K demonstrates itself to be a competent CPU capable of handling a variety of workflows at or exceeding the performance of the top-end Ryzen CPU, especially given the better memory support it has. However, these tasks are also ones where the 3D V-Cache models of Ryzen processors have historically excelled, so if we see a 9000X3D series CPU from AMD in the future may allow them to dominate in this type of workflow.
CPU Rendering: Cinebench, Blender, & V-Ray
CPU rendering, especially with this class of hardware, tends to be more of an enthusiast activity than a professional one. It is certainly done, but in most cases, a GPU will provide a much better experience for desktop rendering, and anyone actually using CPU rendering will end up investing in a much more powerful AMD Theadripper or Threadripper PRO CPU. However, Cinebench is also the synthetic CPU benchmark of choice for many people, and many of the rendering engines can also act as proxies for other highly parallelized workloads.
Starting with Cinebench multi-core, the Ultra 9 285K makes a solid generational gain of 15%, leapfrogging over the Ryzen 9950X by 12%. The Ultra 7 265K makes smaller gains of only 8%, but this does place it within 5% of AMD’s top-end 9950X and 18% faster than the 9900X. As we’ll see, which application you are using can make a huge difference, but for Cinebench, AMD is no longer the multi-core champion. The 245K, at the low end, splits the difference of its higher-core compatriots, with an uplift of 10% over the 14600K, beating out both the 9700X and 9600X.
In single-core Cinebench renders, we see much smaller gains gen-on-gen. The 285K leads the chart, followed by the 265K, with a 12% uplift over the 14900K and outperforming the 9950X by 5%. These are solid improvements, but the difference between 265K and 14700K is only 10% (with 285K and 14600K being slightly larger outliers), with most of AMD’s Ryzen competition only a few percent slower. Most CPUs are nearly identical in this benchmark, and we expect that changes in RAM speed could account for a good portion of that difference—relevant for enthusiasts but possibly less so for professionals.
For Blender, AMD’s 9950X continues to be the premier processor, with a small (3%) lead over the 285K—prior to the BIOS and Windows branch scheduler update, the processors would have had the same score in our testing. This is a result of the good-but-not-great 14% performance improvement for the 285K over the 14900K. The 9900X does seem fairly pointless in Blender, though, with both the slightly more expensive 285K and somewhat less expensive 265K outperforming it. Speaking of the 265K, it sees a 6% uplift over the 14700K, while the 245K only gains 4% over the 14600K.
V-Ray is yet another rendering application that benefits from good multi-core performance. Unlike Blender and Cinebench, it is an application where, with Ryzen 9000, AMD saw massive performance gains, likely due to its enhanced AVX512 support. The Intel Core Ultra 285K also sees good gains of 17% over the 14900K, but this still leaves the 9950X 9% ahead of it. The 265K manages not nearly catch the last-gen 14900K with a 6% performance gain over the 14700K, though it still trails the more-expensive 9900X. On the low end, the 245K has a similar 6% gen-on-gen performance uplift over the 14600K, but this does allow it to outperform the more expensive 9700X by a small amount and the less-expensive 9600X by nearly 30%.
How good are the Intel Core Ultra 200 Series processors for Content Creation?
Intel’s Core Ultra 200S series of processors achieve a small uplift over the last-generation Raptor Lake parts, with gains ranging from nothing to 15% depending on the application and workflow. Unlike AMD’s recent Ryzen 9000 series, there are relatively few applications where Intel sees stagnation or regression and no applications where it sees very large gains. Instead, most average about a 10% performance increase, which is on the lower end of generational gains but much better than some recent Intel launches.
In Photoshop and DaVinci Resolve, the new 200S series processors have no significant performance difference from their 14th-gen counterparts. Photoshop continues to be an area where, since our last benchmark overhaul, Intel has heavily trailed behind AMD across the board, with even the 9600X beating out the 285K by 11%. In Resolve, Intel stays competitive with AMD, particularly for LongGOP and Intraframe codecs, but the best overall CPU is still the 9950X—or 14700K on more of a budget.
For Premiere Pro and Unreal Engine, Intel manages moderate generational uplifts, though Unreal Engine is something of a mixed bag. The 200S series processors average a gen-on-gen increase of about 5% in Premiere Pro, positioning them solidly ahead of the competition. Especially in LongGOP workflows, Intel’s non-F CPUs are the best available option. For Unreal, the 285K does well, but we have what we believe to be non-representative results for the 265K and 245K. If so, they will likely see similar gains as to the 285K, but for now, we can’t recommend them for the tested Unreal Engine tasks until the performance quirks are worked out.
Finally, in After Effects and our CPU Rendering tests, the Core Ultra series 2 processors average a performance gain of 10-15% compared to last-gen. The benefits in After Effects are primarily reaped by the 285K, but both the 265K and 245K are competent in this application as well. For CPU rendering, Intel has managed to take the performance crown in Cinebench (single- and multi-threaded) with the 285K. The other CPUs make more modest gains but are also very competitive. In V-Ray and Blender, AMD still has the best performance with the 9950X, but Intel has closed the gap substantially and, on the lower-end SKUs, handily beats AMD.
We had high hopes for Intel’s Core Ultra 200S series of processors after a number of generations of disappointing launches and the Vmin Shift Instability of 13th and 14th Gen. Although not the largest set of generational gains we have seen, Intel has managed to at least match AMD’s recent Ryzen 9000 series and keep the competition going. Intel has managed to do so while fundamentally changing how they build their CPUs, and disabling hyperthreading is impressive, but ultimately, only the performance, price, and efficiency matter.
As is usual, there is no singular winner in the consumer CPU space, with both manufacturers providing the best performance, or best performance per dollar, in specific workflows.
If you need a powerful workstation to tackle the applications we’ve tested, the Puget Systems workstations on our solutions page are tailored to excel in various software packages. If you prefer to take a more hands-on approach, our custom configuration page helps you to configure a workstation that matches your exact needs. Otherwise, if you would like more guidance in configuring a workstation that aligns with your unique workflow, our knowledgeable technology consultants are here to lend their expertise.


