Table of Contents
TL;DR: How does the 14900KS perform for content creation?
Overall, the Intel Core i9 14900KS scored about 2-15% faster than the Core i9 14900K in content creation applications for a 17% higher MSRP. The best performance increases come from CPU rendering benchmarks, although this is also where AMD has the lead with their similarly-priced 7950X. In lightly threaded workloads like Premiere Pro, the 14900KS is the fastest CPU for content creation, but typically only by a few percent over the 14900K. Due to this, the 14900KS is likely not worth the investment for most professional content creators.
Introduction
A few days ago, Intel launched the Intel Core i9-14900KS processor, a new variant of their popular 14900K model. This isn’t the first time they’ve released a special “S” SKU processor. Typically, we see them partway through a product lifecycle after they have built up enough maturity in their process—and stock of CPUs—to be able to consistently find over-performing chips and package them as a new product. For example, the Intel Core i9-13900KS launched in January of 2023, and the Core i9-12900KS launched in April of 2022.
Like previous “S” SKUs, the 14900KS is a better-binned version of the 14900K. Due to this, it can reach higher clock speeds at a lower voltage—while remaining stable—than the average 14900K. This allows Intel to increase the base power draw and maximum boost frequency of the CPU but also makes the chips more desirable for enthusiasts looking to overclock their processors. These broad-level changes are similar to what we saw from Intel’s 13900KS compared to the 13900K, alongside a similar price increase.
This improved binning means that the 14900KS should be reaching 6.2 GHz out of the box and allow for some impressive overclocking records. While neither of those has much relevance for content creation workstations, it is exciting to see how much they can get out of their Raptor Lake architecture when they have time to refine it, as this is likely the last release from this architecture before their rumored 15th Gen “Arrow Lake” processors are loosed.
Since the 14900KS is expected to be a fairly minor upgrade over the 14900K when not overclocking, this review is more limited in scope than our typical articles. Specifically, we will only be looking at a couple of different CPU models, rather than comparing against the full Intel 14th Gen product stack like we do when a full product line is released. Below, we have listed the most relevant CPU specifications from AMD and Intel. You can visit Intel Ark or AMD’s Ryzen page for more information.
| CPU Model | MSRP | Cores (Threads) | Maximum Boost Clock | TDP (Max) | Release Date |
|---|---|---|---|---|---|
| AMD Ryzen 9 7950X | $700 | 16 (32) | 5.7 GHz | 170 W (~230 W) | Sept. 2022 |
| Intel Core i9-14900KS | $690 | 8P + 16E (32) | 6.2 GHz | 150 W (253 W) | Feb. 2024 |
| Intel Core i9-14900K | $590 | 8P + 16E (32) | 6 GHz | 125 W (253 W) | Oct. 2023 |
As stated above, the changes from the 14900K to the 14900KS are relatively minor compared to the price increase of $100 dollars (or, around a 17% higher MSRP). The KS has a higher maximum boost clock of 200 MHz on 1-2 cores to 6.2 GHz, an 8-core turbo of 5.9 GHz (up from 5.7 GHz), and a 100 MHz increase in E-core turbo to 4.5 GHz. This is facilitated by a 25 W increase in PL1. Overall, we are not expecting any large performance gains from these CPUs based on these spec bumps, but some workloads are sensitive to frequency.
Pricing on CPUs can be difficult to pin down due to the healthy competition between Intel and AMD, which results in frequent sales and temporary price adjustments. Due to this, we try to report the MSRP as that is the worst-case price you should ever have to pay, and discounts tend to be similar between the manufacturers. If you are buying a CPU for yourself, be on the lookout for any sales that may change what CPUs should be compared to each other based on price.
Test Setup
Intel Core Test Platform
| CPUs: Intel Core i9-14900KS Intel Core i9-14900K |
| CPU Cooler: Noctua NH-U12A |
| Motherboard: ASUS ProArt Z690-Creator WiFi BIOS version: 3302 |
| RAM: 2x DDR5-5600 32GB (64GB total) Running at 5600 Mbps |
| GPU: NVIDIA GeForce RTX 4080 16GB Driver Version: Studio 551.61 |
| PSU: Super Flower LEADEX Platinum 1600W |
| Storage: Samsung 980 Pro 2TB |
| OS: Windows 11 Pro 64-bit (22631) |
AMD Ryzen Test Platform
| CPUs: AMD Ryzen 9 7950X |
| CPU Cooler: Noctua NH-U12A |
| Motherboard: ASUS ProArt X670E-Creator WiFi BIOS Version: 1905 |
| RAM: 2x DDR5-5600 32GB (64GB total) Running at 5200 Mbps |
| GPU: NVIDIA GeForce RTX 4080 16GB Driver Version: Studio 551.61 |
| PSU: Super Flower LEADEX Platinum 1600W |
| Storage: Samsung 980 Pro 2TB |
| OS: Windows 11 Pro 64-bit (22631) |
Benchmark Software
| Photoshop 25.5 – PugetBench for Photoshop 1.0 |
| Premiere Pro 24.2.1 – PugetBench for Premiere Pro 1.0 |
| DaVinci Resolve 18.6.5 – PugetBench for DaVinci Resolve 0.98.0 alpha |
| After Effects 24.2 – PugetBench for After Effects 0.96 |
| Unreal Engine 5.3 |
| Cinebench 2024 |
| Blender 4.0 |
| V-Ray 5.02.00 |
Although this CPU is positioned as an enthusiast processor, we do all of our testing for performance through the lens of a workstation system integrator. This helps us target what is important to our customers and the broader workstation community while maintaining consistency in our testing. To that end, we used our standard CPU benchmarking setup with ASUS ProART boards, 64 GB of DDR5 running at the maximum (non-OC) supported speeds in a dual-channel configuration, and NVIDIA RTX 4080s. We are still currently testing out consumer desktop CPUs with the Noctua NH-U12A cooler, which we have found to be wholly sufficient when running the CPUs at their “standard” (non-“Extreme”) specified configurations.
Both Intel and AMD have been increasing their CPUs’ overall power draw to get as much performance as possible. This results in multiple power profiles being considered as “in spec” as well as a number of (typically enabled by default) auto-overclocking features—features that will void your warranty. For Intel, these “performance” or “extreme” power profiles typically feature a PL1 = PL2 (in effect, perpetual boost) and may also include an elevated maximum current or PL2; for the 14900KS, this is a PL1 = PL2 = 320 W and IccMAX = 400 A. If you are using one of these extreme profiles, a large AIO cooler is recommended, but for our testing, we are using the “standard” profiles:
| Processor | PL1 (W) | PL2 (W) | Tau (S) | ICCMax (A) |
|---|---|---|---|---|
| 14900KS | 150 | 253 | 56 | 307 |
| 14900K | 125 | 253 | 56 | 307 |
We are constantly evaluating the power specifications we use on our processors. Our goal is to balance the tradeoffs of power draw, temperature, noise, and performance, so it is something on which we are always looking for feedback. Although we have not published an article looking at those factors for the 14900KS, we did back at the launch of Intel 14th Gen.; The results are largely similar: Power Draw and Cooling: 14th Gen Intel Core Processors. In short, running these CPUs at unlocked power limits minimally impacts performance in most tested applications but dramatically increases the heat output (and noise) under load.
On the software side, our benchmark suite consists of a mix of industry-standard benchmarks, split between our own PugetBench benchmarks and third-party benchmarks. These include our 1.0 versions of PugetBench for Adobe Photoshop and Premiere Pro and alpha/beta versions of our After Effects, DaVinci Resolve, and Unreal Engine 5.3 benchmarks. Of note, we are using an internal 0.98 alpha version of DaVinci Resolve, which includes several updated tests from the publicly available 0.93.1 version. We supplement these with the Cinebench 2024, V-Ray, and Blender rendering benchmarks.
Graphic Design: Adobe Photoshop
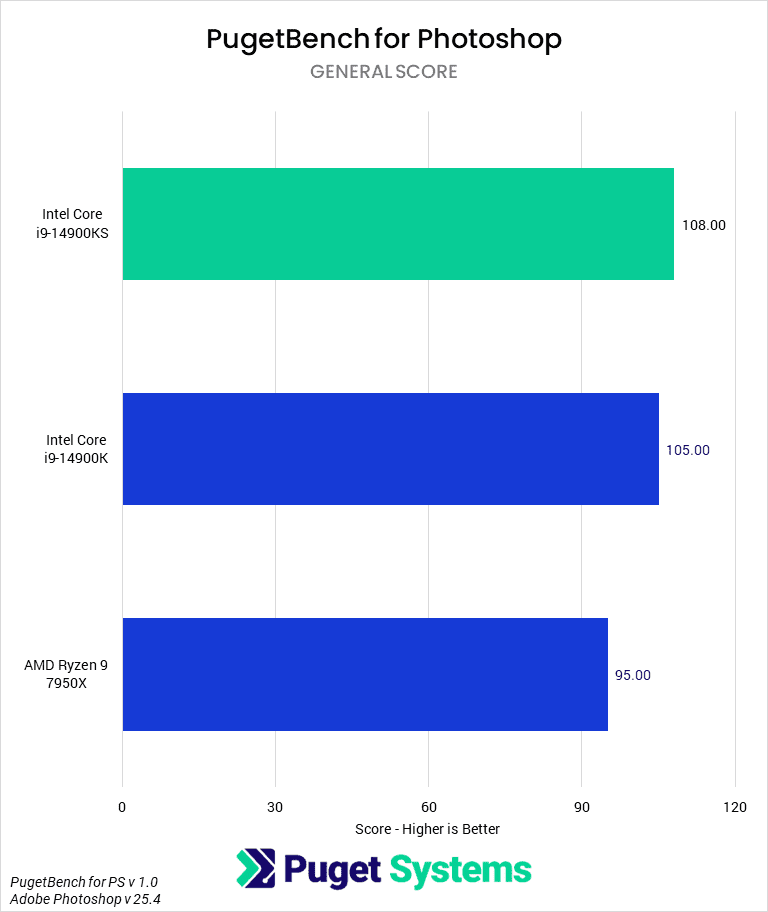
The first benchmark we want to take a look at is Adobe Photoshop. When we first reviewed the Intel Core i9 14900K, we found marginal performance increases from Intel’s 13th Gen processors. This trend continues in the 14900KS, which is only a few percent faster than the 14900K in this test—less than the margin of error of the benchmark. The 14900KS is good in Photoshop, but most users won’t find it to be worth the higher cost over the 14900K.
Video Editing: Adobe Premiere Pro
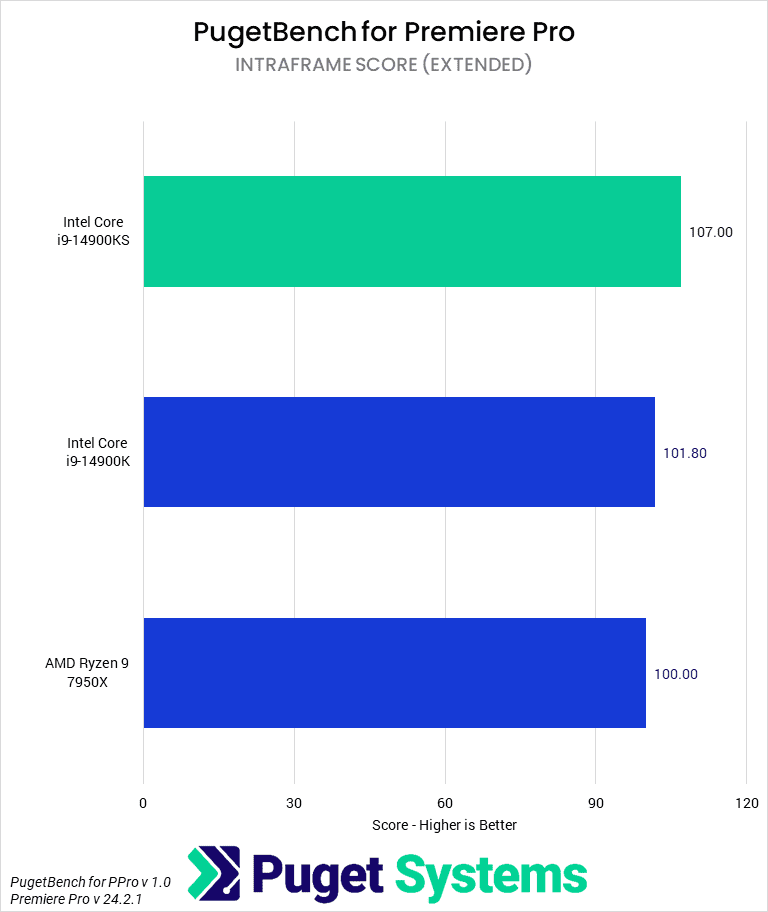
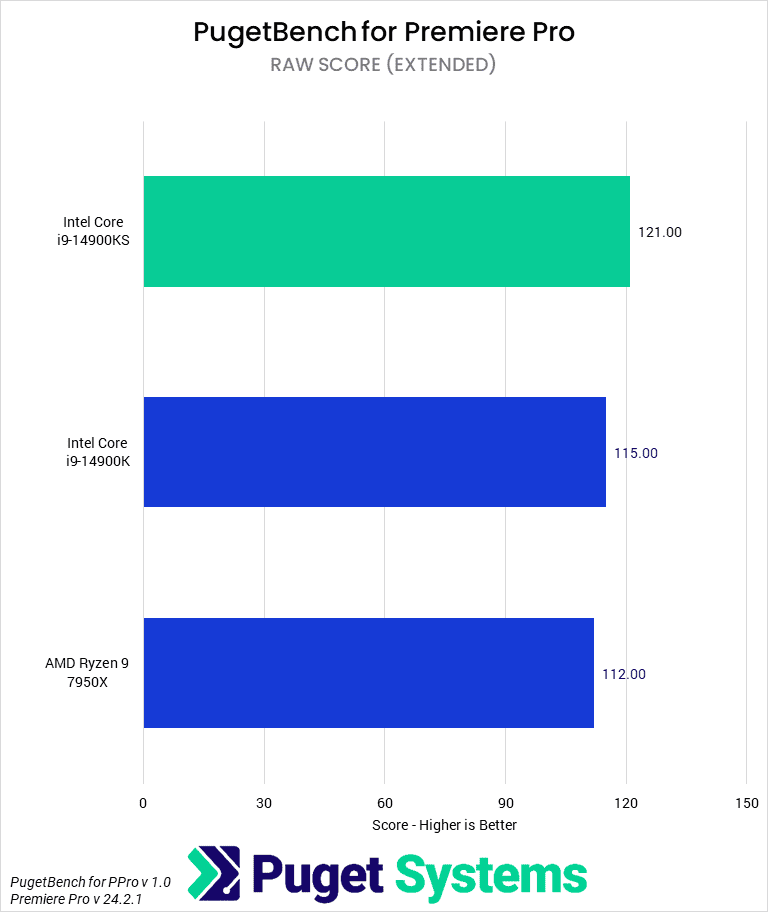
Moving on to Adobe’s Premiere Pro, we see a small performance bump for the 14900KS of just under 5%. This is right on the edge of what we would typically consider to be the margin of error for real-world benchmarks like this, but since we moved to the release 1.0 version, our expected variation is 2% on the overall score, and around 5% for the other scores, meaning we are comfortable calling this a statistically significant, if small, difference.
Overall, Premiere Pro shows a consistent performance increase of about 5% across the board. This does make the 14900KS the fastest consumer desktop CPU for Premiere Pro overall, but at a cost increase of $100 over the 14900K, it is still probably a better value to get the non-“S” CPU instead.
Motion Graphics: Adobe After Effects
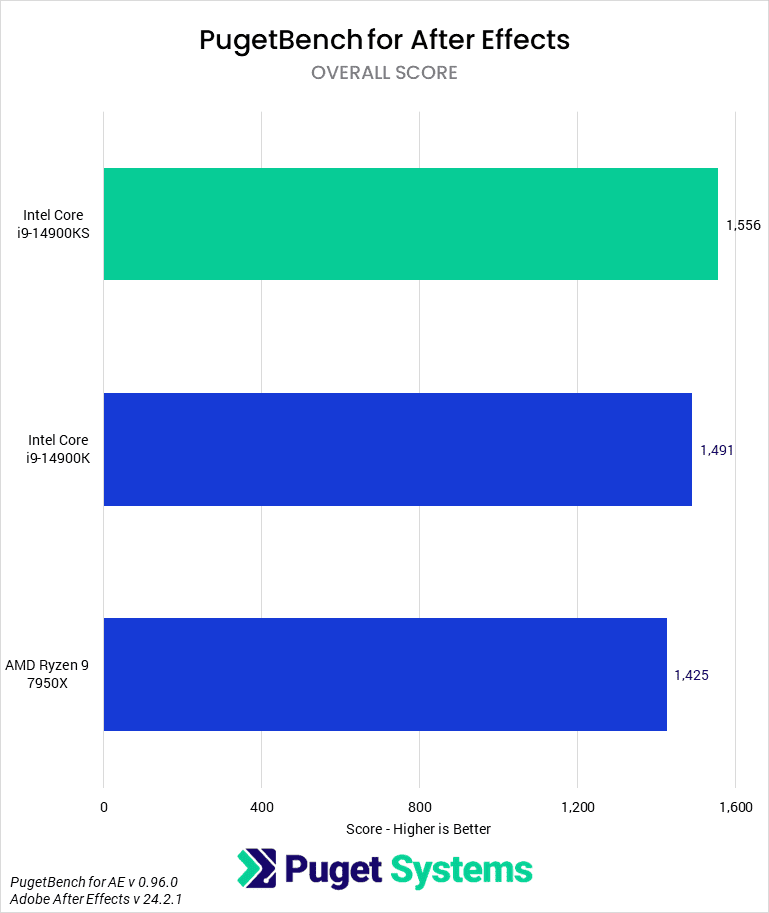
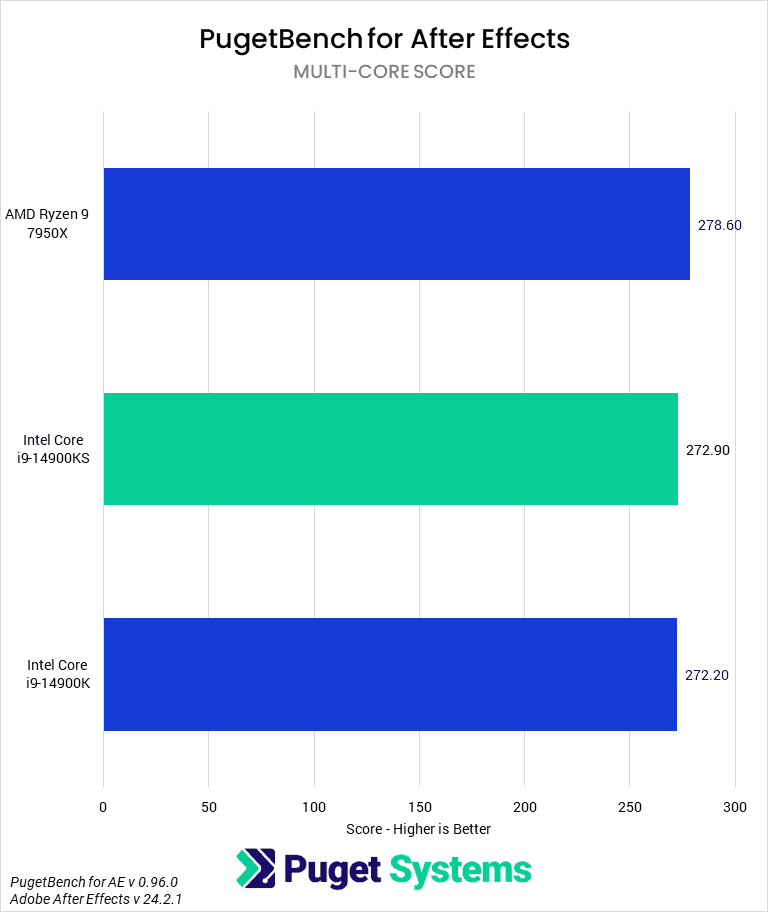
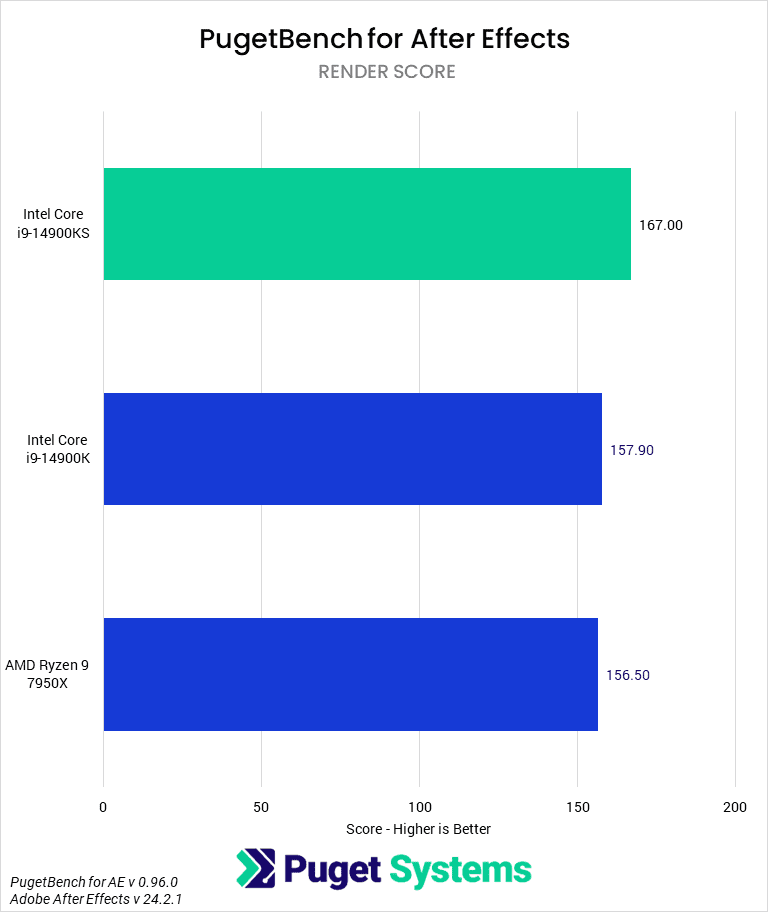
After Effects shows an even smaller performance gain than Premiere Pro at about 4%. This means it has essentially the same performance as the 14900K, making it a hard sell over the 14900K. It could make sense if you need the best performance possible and can’t afford to move up to the AMD Threadripper line. However, it is worth pointing out that if you work with heavy projects in After Effects (that makes good use of the multi-frame rendering feature), the 7950X will give you better performance for the same price.
Video Editing / Motion Graphics: DaVinci Resolve Studio
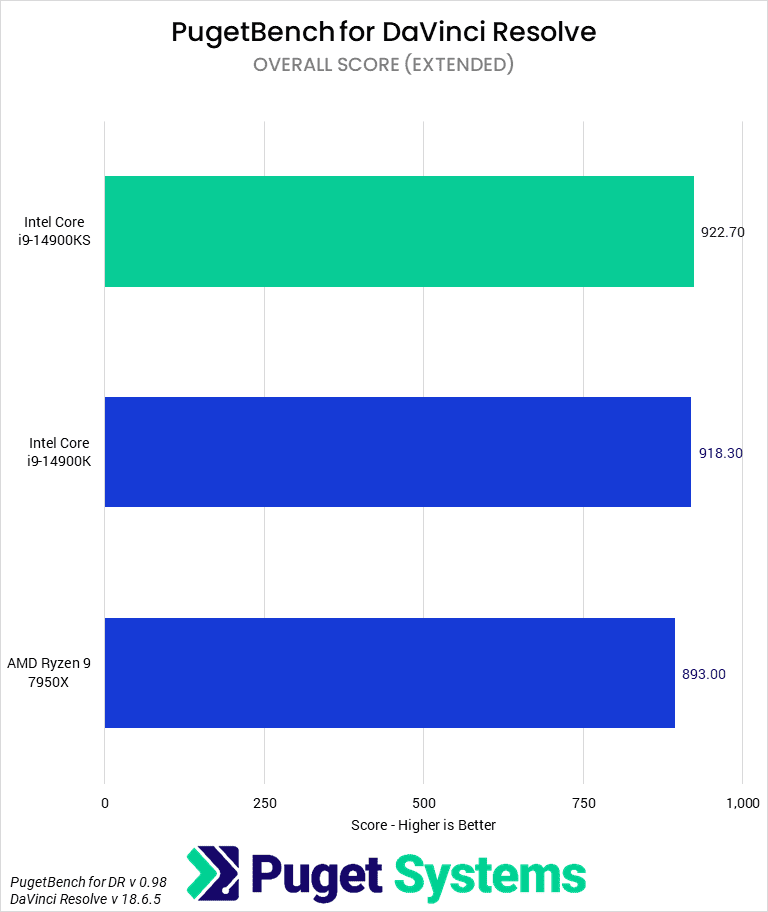
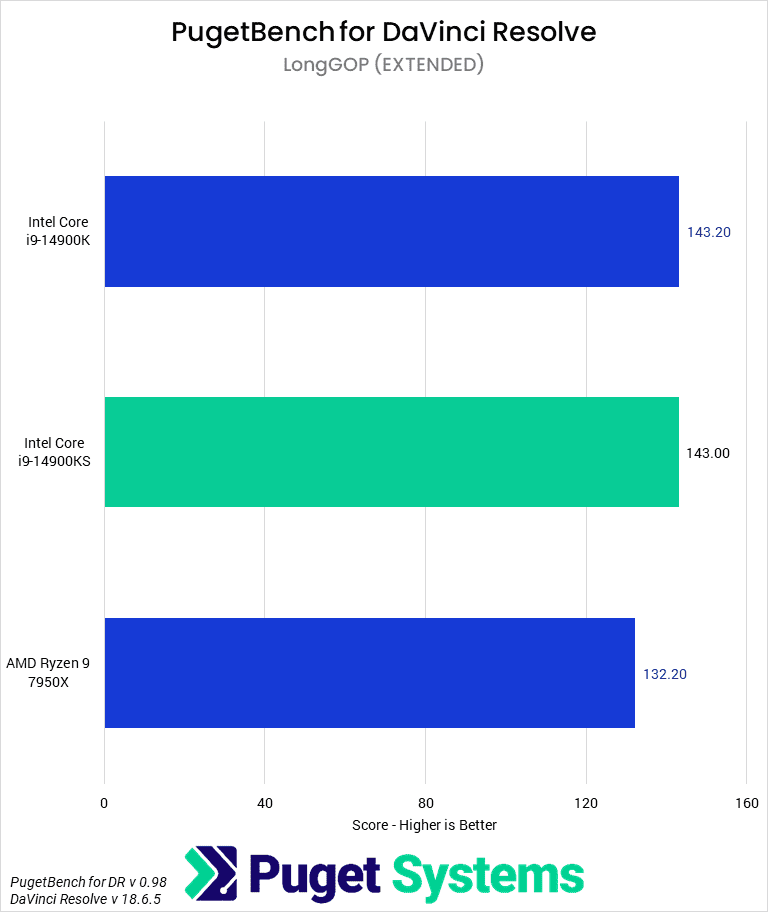
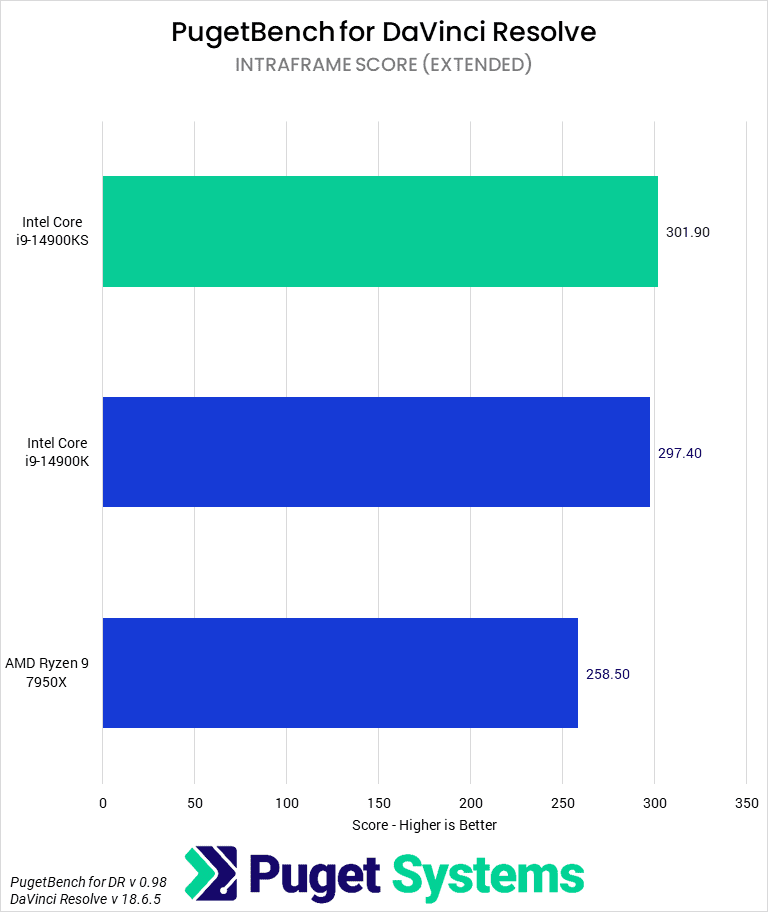
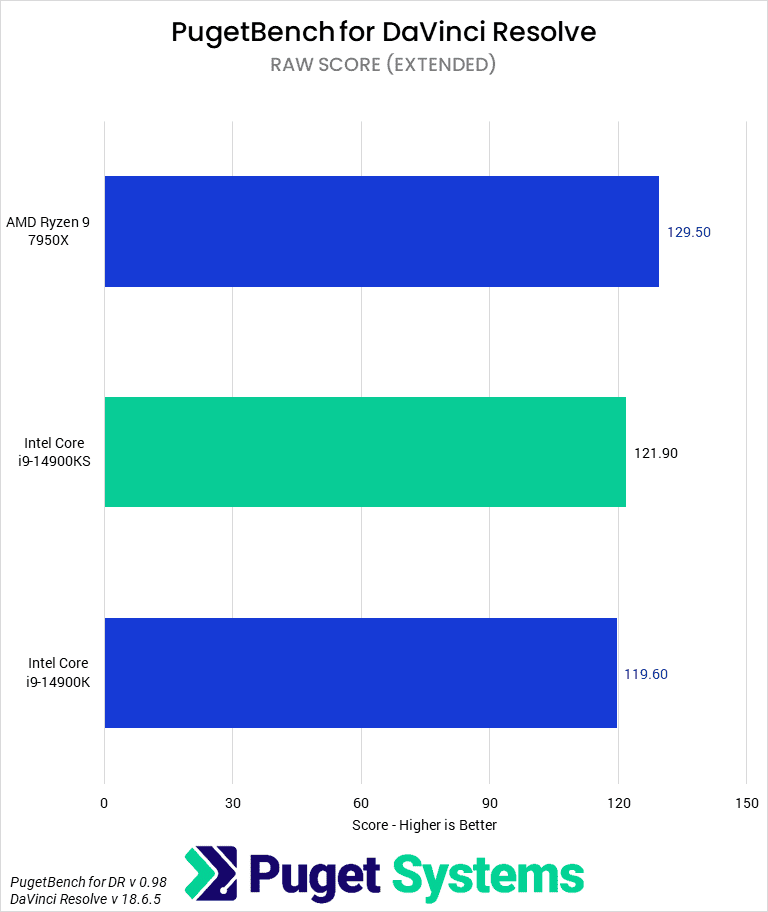
Continuing the trend of less significant results for the 14900KS, DaVinci Resolve shows an average performance difference of under 1% from the 14900K. The Intel i9 processors are still better than the 7950X for most uses, but the 14900KS will not provide any benefit over the 14900K for the increased price. This is likely in part due to the fact that much of DaVinci Resolve is heavily GPU-accelerated, and while the underlying platform can make an impact on those GPU workloads, the small difference between the 14900KS and 14900K is pretty much non-existent.
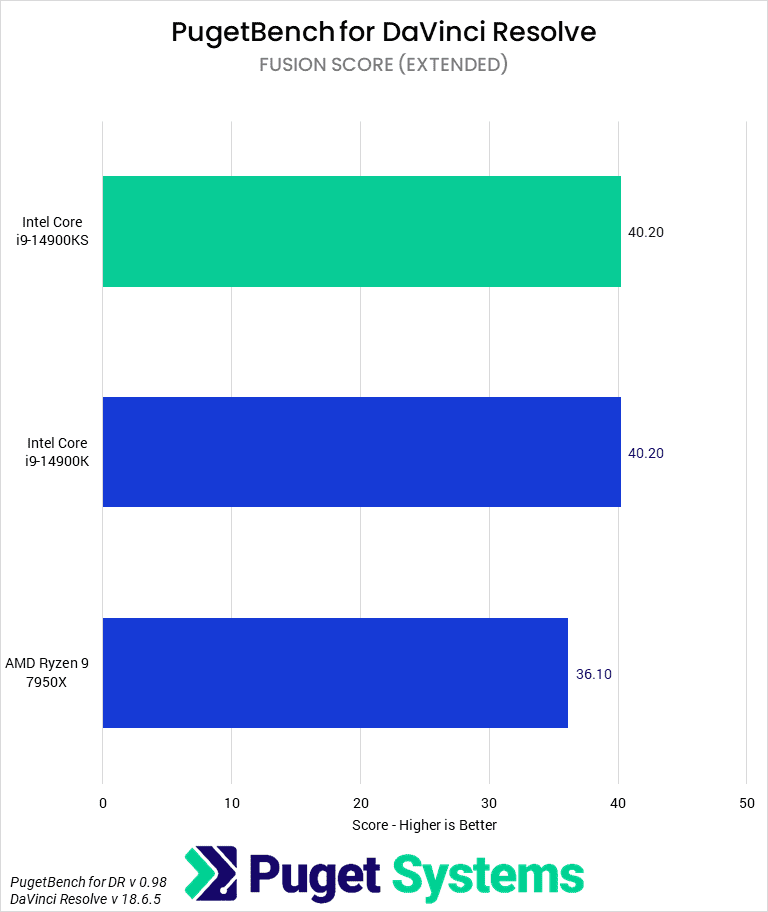
However, even the Fusion portion of our benchmark (which behaves similarly to Adobe After Effects in that it is mostly CPU bottlenecked), the 14900KS and 14900K ended up with identical scores.
Game Dev / Virtual Production: Unreal Engine
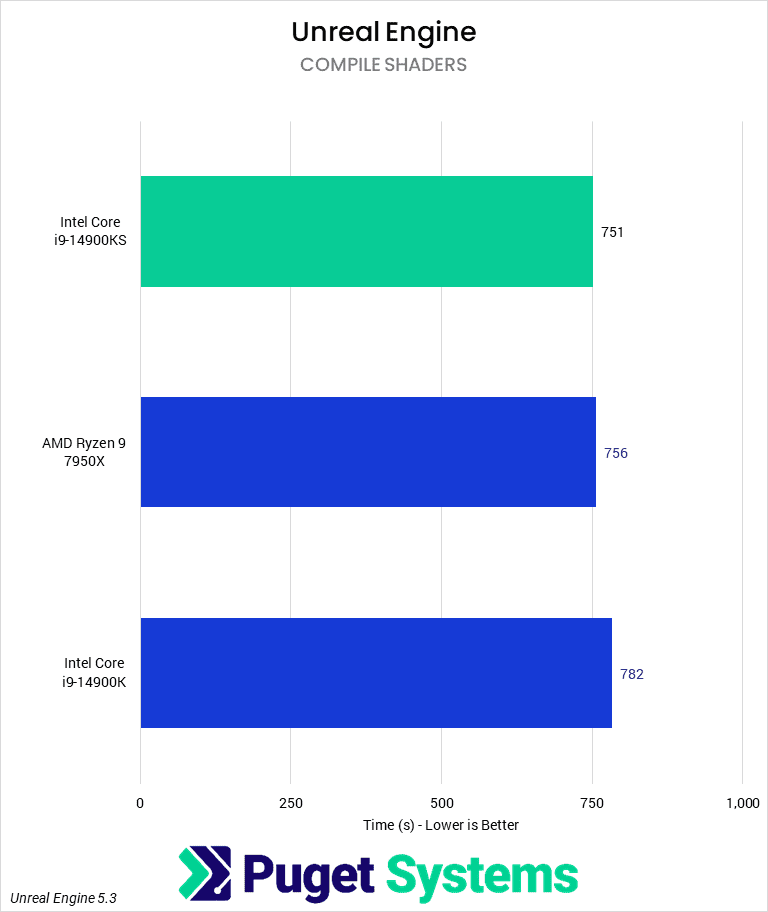
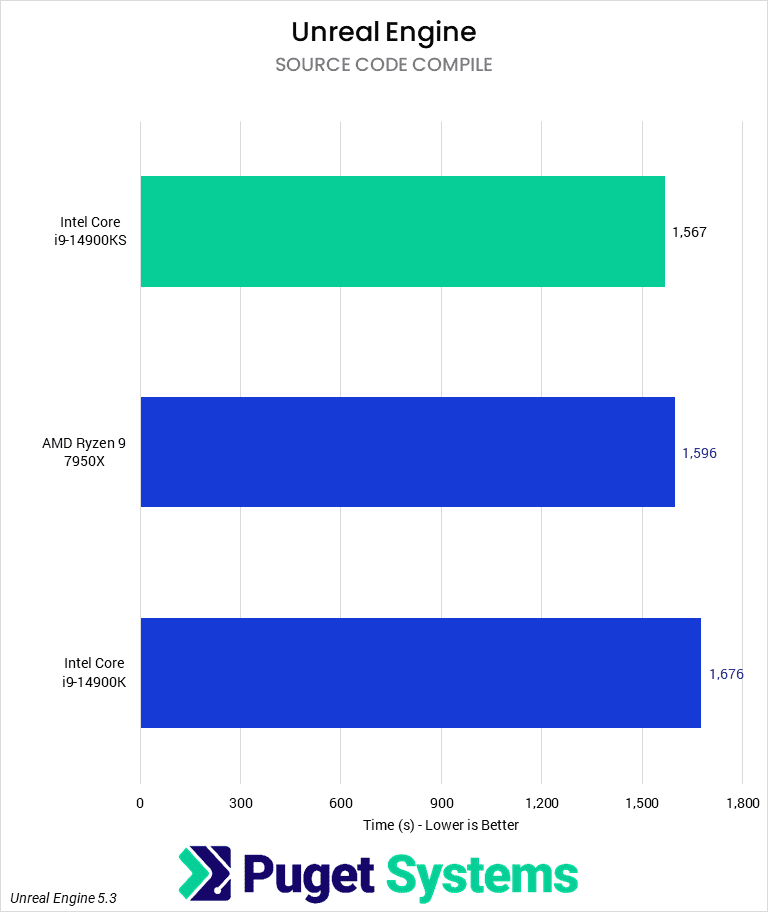
Our CPU Unreal Engine benchmarks represent a variety of workflows that may be done on the CPU, but in many ways, they are somewhat of a “synthetic” benchmark for CPUs of this caliber. Although most users will need to compile shaders at some point in time, Light Baking is increasingly being discarded in favor of GPU-based solutions or Unreal’s Lumen. Similarly, while compiling Unreal Engine is a CPU-based task, it will frequently be pushed to a larger build server rather than be run on individual workstations.
Nonetheless, we see some interesting results from the 14900KS. Compared to the 14900K, we see an average performance increase of about 6%, meaning it edges out the 7950X in the code compilation benchmark. This probably isn’t a large enough performance increase to justify the 14900KS over the 14900K, given the infrequent nature of most of these tasks, but it certainly approaches the point of consideration. Although not tested here, at the price point of the 14900KS, you may also want to take a look at the AMD Ryzen 7950X3D, as that CPU performed very well in many of the Unreal Engine benchmarks due to its increased L3 cache.
CPU Rendering: Cinebench 2024
Cinebench is the first of our rendering benchmarks, which makes heavy use of all the cores on a CPU. Typically, we expect users to look for higher-end CPUs like the AMD Threadripper 7000 Series to maximize CPU rendering performance. However, there are still some situations where an Intel Core or AMD Ryzen CPU makes more sense for an overall workload, but you want to ensure CPU rendering performance is still decent. Cinebench is also interesting in that it has single-core tests in addition to multi-core tests. Although rendering wouldn’t typically be done on a single CPU core, the single-core score does act as a good proxy for some modeling work.
Looking at performance, the 14900KS offers an impressive 13% performance increase over the 14900K. We suspect a lot of this is due to the increased multi-core frequencies and elevated power budget, but this is the first properly impressive gain we have seen so far. Unfortunately, the 14900KS still falls just behind the 7950X for multi-core rendering, meaning that the AMD CPU is a better value.
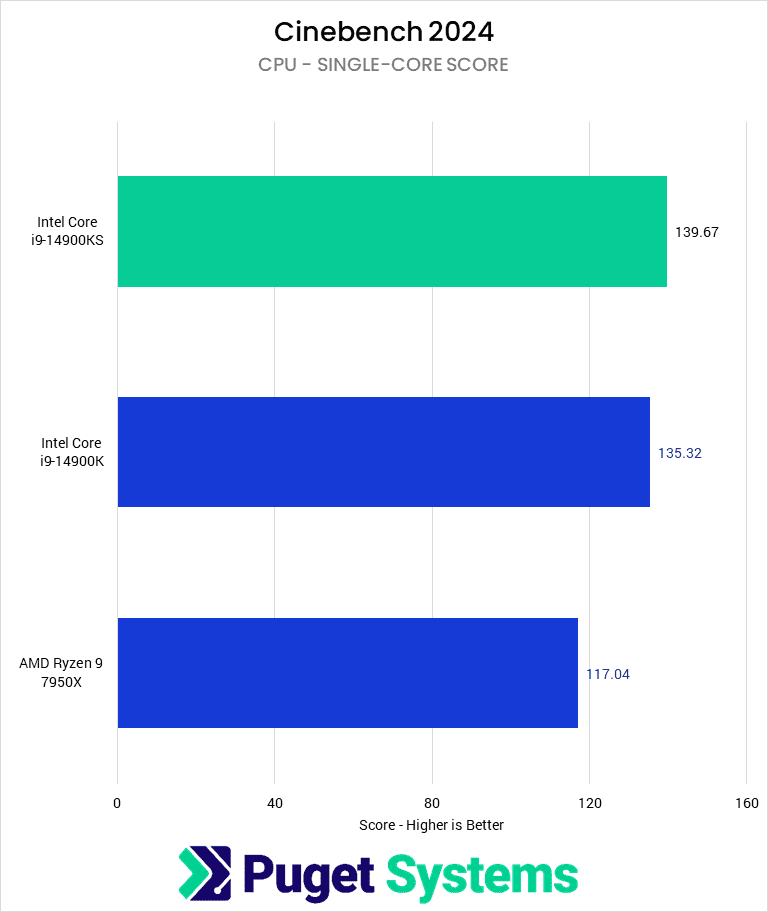
In terms of single-threaded performance, the 14900KS is now the fastest single-threaded CPU, although it is only 3% faster than the 14900K. It is impressive to see Intel continue to get these performance improvements from their Raptor Lake architecture, but 3% isn’t enough to justify the higher price.
CPU Rendering: V-Ray
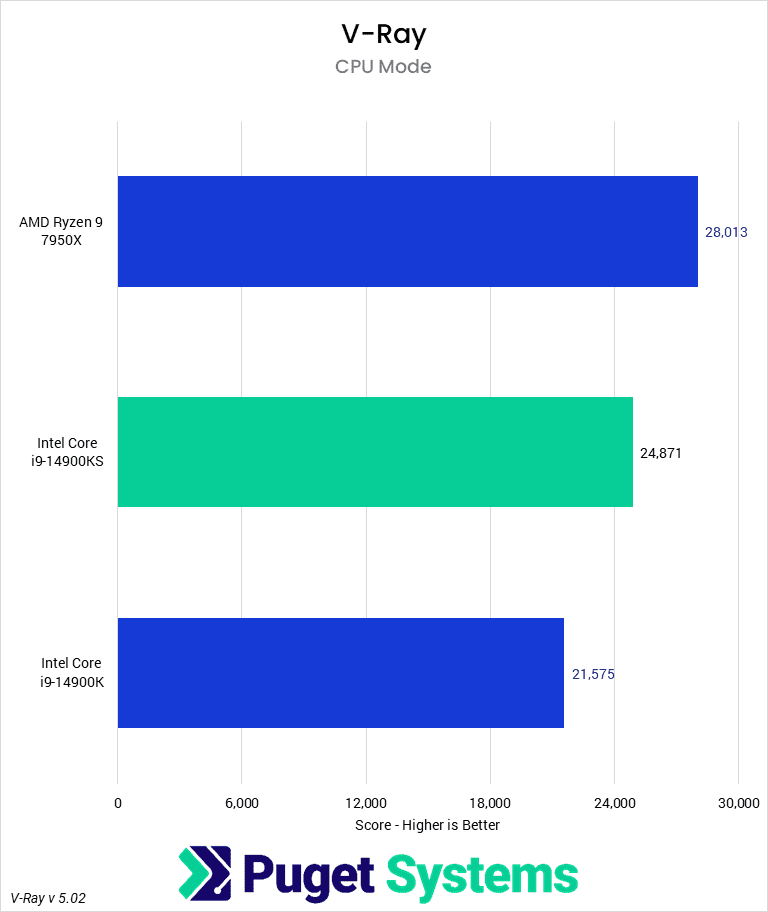
Moving on to V-Ray, the 14900KS is 15% faster than the 14900K, but still 15% slower than the 7950X. Although a large performance gain over the 14900K, we wouldn’t recommend the 14900KS for rendering in V-Ray simply because the 7950X is faster at a similar price point.
CPU Rendering: Blender
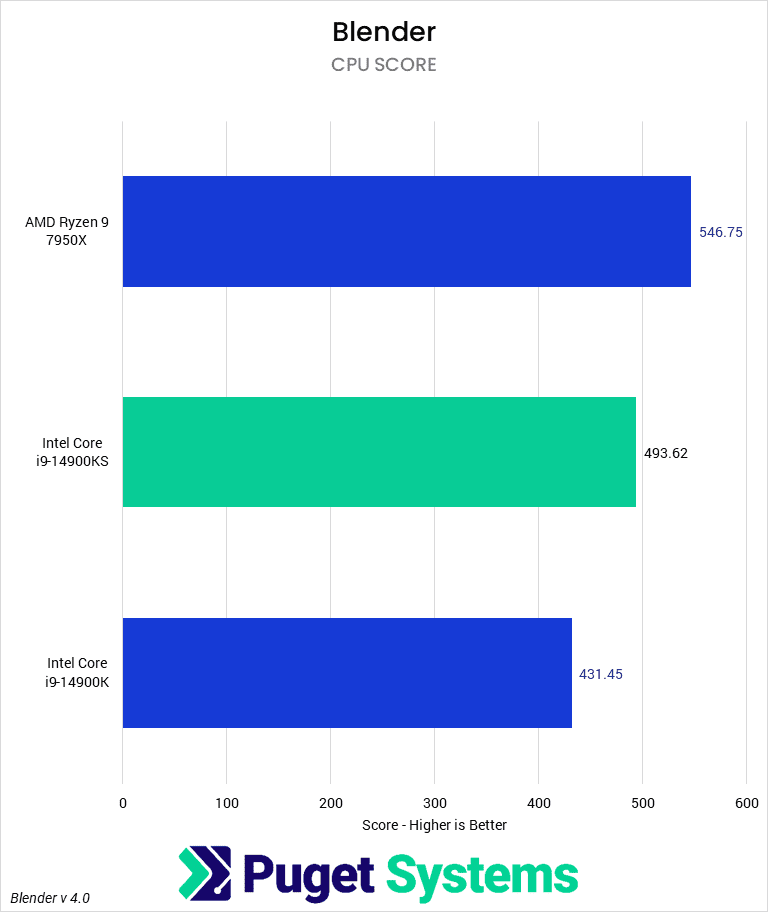
Finally, we have the Blender 4.0 rendering benchmark. Like Cinebench and V-Ray, the 14900K is about 15% faster than the 14900K. This is a good performance increase for the price increase but still falls short of the similarly-priced 7950X by about 10%.
How good is the Intel Core i9-14900KS for content creation?
The Intel Core i9-14900KS, much like the previous “S” variants of processors, offers a small upgrade over the non-S counterpart: the Intel Core i9-14900K. Like those previous CPUs, the 14900KS offers relatively minor performance improvements over the 14900K, given the $100 (17%) higher price, putting it on par with the AMD Ryzen 7950X in terms of base MSRP.
Looking at lightly threaded workloads like Photoshop, Premiere Pro, After Effects, and DaVinci Resolve, we saw an average performance improvement of just 2-6%. Although not large, this is about as much performance uplift as we saw when moving from 13th to 14th Gen in general, and it does make the Intel 14900KS the fastest desktop CPU for most of these workloads.
In heavily multi-threaded workloads like Cinebench, Unreal Engine, V-Ray, and Blender, the 14900KS is a much more significant 6-17% faster than the 14900K. It does especially well in the multi-core rendering benchmarks, averaging a 15% performance increase. However, while this is a very impressive gain, it is still 10-15% slower than the AMD Ryzen 7950X for those workloads, limiting the number of users who would be interested in it over the 7950X. This is also an area where the processor would most benefit from using one of Intel’s “Extreme” or “Performance” power profiles to help sustain multi-core boost.
Ultimately, the better-binned “S” spec CPUs from Intel are made primarily for enthusiasts who intend to overclock their CPUs. As we do not overclock any of the systems we sell due to our focus on stable and reliable workstations, the new Core i9 14900KS CPU offers us relatively little benefit over the standard 14900K. The performance gains can be impressive in certain workloads, but unfortunately for Intel, those same workloads are ones where AMD Ryzen has a large performance lead that the 14900KS is not able to close fully. The 14900KS is by no means a bad CPU, and will undoubtedly be popular with those who want the absolute fastest Intel Core processor possible, but it is largely unnecessary for professional content creation users.
If you need a powerful workstation to tackle the applications we’ve tested, the Puget Systems workstations on our solutions page are tailored to excel in various software packages. If you prefer to take a more hands-on approach, our custom configuration page helps you to configure a workstation that matches your exact needs. Otherwise, if you would like more guidance in configuring a workstation that aligns with your unique workflow, our knowledgeable technology consultants are here to lend their expertise.


