Table of Contents
Introduction
While AMD has been fairly successful in recent months with both CPU and GPU launches—expect our 9070 XT review in the near future—it has struggled to keep one of its hottest products in stock: the 9800X3D. Although we don’t know if the two products we will be reviewing today will help address that issue, we are excited to finally look at the long-awaited AMD Ryzen™ 9950X3D and 9900X3D. These processors promise to marry AMD’s gaming dominance of the 9800X3D with the high multi-core performance of its 9950X and 9900X.
For the last two generations of X3D parts, they have been somewhat of a novelty for professional users. Availability was poor, the sacrifice in performance for most non-gaming workflows was notable, and they came at a higher cost. We saw progress with the 7000X3D parts, as AMD was able to reduce the frequency penalty from the 3D V-Cache, but CCD scheduling issues and cooling constraints still caused issues. However, with the 9800X3D, we were encouraged by AMD’s ability to keep a higher PPT (and so, frequency) on an X3D part. Now, we get to see if they finally figured out CCD scheduling.
Image
First, a brief aside of what is new about these processors, taken from our previous 9800X3D review: The key difference with AMD’s 2nd generation of 3D V-Cache (both the 5000X3D and 7000X3D CPUs were on the now retronymic 1st generation 3D V-Cache) is the location of the L3 cache. For context, the defining feature of the stacked or 3D V-Cache is that, unlike a traditional CPU design where the L3 cache is on the same plane as the CPU cores, the L3 cache is located vertically above the CPU cores. With the second-gen 3D V-Cache, the L3 cache has been moved to be below the CPU die, such that the physical cores are closer to the integrated heat spreader—rather than being separated from it by the cache. This, theoretically, improves thermal transfer from the cores to the cooling solution, allowing them to better dissipate power. In turn, the power limits of the CPU can be increased, and the cores can further increase clock frequencies.
One of the potential difficulties of the 9950X3D and 9900X3D over the 9800X3D is how the CPU with 3D V-Cache is constructed. AMD’s CPUs are constructed out of chiplets, with individual pieces of silicon for I/O (including memory controller) and the CPU cores. These chiplets are then connected together via a silicon interposer. However, each of the chiplets for CPU cores has a maximum of eight cores on it, so for core counts higher than eight, AMD has to include multiple core chiplets, known as CCDs (Core Complex Dies). The 9900X has two CCDs with six functional cores each, while the 9950X has two fully functional eight-core CCDs.
In these multi-CCD 3D V-Cache-enabled processors, the additional “stacked” cache is only located on one of the two CCDs. This has both pros and cons. As for benefits, having the additional cache on only one CCD means that the other can be more aggressive in terms of voltages, frequencies, and power draw. This should allow it to have better performance in non-cache-constrained scenarios. However, the downside is twofold. First, since the cache is “lopsided”, the average latency penalty for any given cache hit is greater than in a non-3D-V-Cache-enabled processor (though still less than a cache miss). Secondly, since one CCD is “faster” for any given workflow than the other (either due to cache latency or higher frequency), it is possible to mis-schedule workloads and have lower-than-expected performance in either scenario.
Ultimately, much of the success of these parts depends on how well AMD has managed to reduce the frequency penalty when executing on the V-Cache-enabled CCD and, secondarily, optimize its scheduler to direct workflows appropriately. As to the former, the second-generation 3D V-Cache promises to have solved many of those issues, though we still expect to see some dimorphism. The latter, AMD has a number of technologies, such as the AMD 3D V-Cache Performance Optimizer, AMD Provisioning Packages Service, and AMD Application Compatibility Database, which should, in theory, allow for better scheduling.
Below, we have listed the most relevant CPU specifications from AMD and Intel. For more information, visit Intel Ark or AMD’s Ryzen page.
| CPU Model | MSRP | L2 / L3 Cache (MB) | Cores | Maximum Boost Clock | Default PPT | Release Date |
|---|---|---|---|---|---|---|
| AMD Ryzen™ 9 9950X3D | $700 | 16 / 128 | 16 | 5.7 GHz | 200 W | Jan. 2025 |
| AMD Ryzen™ 9 9950X | $650 | 16 / 64 | 16 | 5.7 GHz | 200 W | Aug. 2024 |
| AMD Ryzen™ 9 9900X3D | $600 | 12 / 128 | 12 | 5.7 GHz | 162 W | Jan. 2025 |
| Intel® Core™ Ultra 9 285K | $590 | 40 / 36 | 8P + 16E | 5.7 GHz | 250 W | Oct. 2024 |
| AMD Ryzen™ 9 9900X | $500 | 12 / 64 | 12 | 5.6 GHz | 162 W | Aug. 2024 |
| AMD Ryzen™ 7 9800X3D | $480 | 8 / 96 | 8 | 5.2 GHz | 162 W | Nov. 2024 |
| Intel® Core™ Ultra 7 265K | $394 | 36 / 30 | 8P + 12E | 5.5 GHz | 250 W | Oct. 2024 |
| AMD Ryzen™ 7 9700X | $360 | 8 / 32 | 8 | 5.5 GHz | 88 W | Aug. 2024 |
| Intel® Core™ Ultra 5 245K | $320 | 26 / 24 | 6P + 8E | 5.2 GHz | 159 W | Oct. 2024 |
| AMD Ryzen™ 5 9600X | $280 | 6 / 32 | 6 | 5.4 GHz | 88 W | Aug. 2024 |
The 9950X3D and 9950X, as well as the 9900X3D and 9900X, are shockingly similar. In the past, we have seen drops in power draw, frequency, and the like due to the inclusion of 3D V-Cache. However, with these two new X3D processors, the only difference from the non-X3D counterparts is the large amount of L3 Cache, most of which is living on one CCD, and the slightly elevated price. At MSRP, the X3D parts carry a $50 price premium over the non-3D parts, though we expect frequent sales on the latter to widen this gap in practice. This is a different strategy from the 9800X3D, which increased PPT to help it sustain higher all-core frequencies.
Test Setup
AMD Ryzen Test Platform
| CPUs: AMD Ryzen 9 9950X3D AMD Ryzen 9 9900X3D AMD Ryzen 7 9800X3D AMD Ryzen 9 9950X AMD Ryzen 9 9900X AMD Ryzen 7 9700X |
| CPU Cooler: Noctua NH-U12A |
| Motherboard: ASUS ProArt X670E-Creator WiFi BIOS Version: 2604 |
| RAM: 2x DDR5-5600 32GB (64 GB total) |
| GPU: NVIDIA GeForce RTX™ 5080 16GB Driver Version: Studio 572.50 |
| PSU: Super Flower LEADEX Platinum 1600W |
| Storage: Samsung 980 Pro 2TB |
| OS: Windows 11 Pro 64-bit (26100) Power Profile: Balanced |
Intel Core Ultra Test Platform
| CPUs: Intel Core Ultra 9 285K Intel Core Ultra 7 265K Intel Core Ultra 5 245K |
| CPU Cooler: Noctua NH-U12A |
| Motherboard: ASUS ProArt Z890-Creator WiFi BIOS version: 1501 |
| RAM: 2x DDR5-6400 CUDIMM 32GB (64 GB total) |
| GPU: NVIDIA GeForce RTX™ 5080 16GB Driver Version: Studio 572.50 |
| PSU: Super Flower LEADEX Platinum 1600W |
| Storage: Samsung 980 Pro 2TB |
| OS: Windows 11 Pro 64-bit (26100) Power Profile: High Performance |
Benchmark Software
| Lightroom Classic 13.1 – PugetBench for Lightroom Classic 0.96 |
| Photoshop 26.2 – PugetBench for Photoshop 1.0.2 |
| Premiere Pro 25.1.0 – PugetBench for Premiere Pro 1.1.0 |
| After Effects 25.2 Beta – PugetBench for After Effects 0.98-beta |
| DaVinci Resolve 19.1 – PugetBench for DaVinci Resolve 1.1.0 |
| Unreal Engine 5.3 |
| Cinebench 2024 |
| Blender 4.0.0 |
| V-Ray 6.00.01 |
For this review, we re-tested all of the processors, though we kept most of the application and driver versions from our latest round of GPU testing we performed for our recent NVIDIA GeForce RTX 5070 Content Creation Review. Intel and AMD systems were on the latest BIOS versions and Chipset drivers, and in Windows, we made sure that VBS was enabled on all the systems.
In terms of processors, we tested the directly-comparable current-gen Intel and AMD CPUs. We excluded the 245K and 9600X as they don’t have X3D counterparts. Unfortunately, we didn’t get a chance to test last-gen X3D parts but, save for a few workflows such as Unreal Engine, they tended to be about 5% slower than the non-X3D variants.
Our power settings follow those used in our Intel Core Ultra 200S review. AMD processors had overclocking features such as MCE, ASUS Medium Load Boostit, and PBO disabled, and RAM was run at JEDEC 5600 Mbps; 5600 is the maximum officially supported speed for these Ryzen processors. We did not use any of the PPT alternatives AMD has now enabled in the BIOS, and we used the Windows “Balanced” power profile, as AMD doesn’t suffer performance penalties for doing so. Since it’s pertinent, we also ensured that CPPC Dynamic Preferred Cores was set to “Driver” in the SBIOS.
For the Intel Core Ultra 200S processors, we used the Intel Performance Profile BIOS setting and ensured that features like Intel APO were enabled (though we don’t expect it to have any performance impact). Our RAM was a JEDEC-specification 6400 CUDIMM kit. Due to our past testing showing much better performance for Intel in the “Performance” power profile, we used that over “Balanced”; in the future, we hope Intel addresses the issues causing low performance in the “Balanced” Windows power profile.
To test the processors, we used a variety of industry-standard benchmarks, including our own PugetBench benchmarks, Cinebench 2024, V-Ray, and Blender. These give us targeted, real-world performance numbers for a variety of content creation applications and help inform us about the components’ performance in other uses.
Looking for a Content Creation Workstation?
We build computers tailor-made for your workflow.
Don’t know where to start?
We can help!
Get in touch with our technical consultants today.
Raw Results Tables
We choose our benchmarks to cover many workflows and tasks to provide a balanced look at the application and its hardware interactions. However, many users have more specialized workflows. Recognizing this, we like to provide individual results for benchmarks as well. If a specific area in an application comprises most of your work, examining those results will give a more accurate understanding of the performance disparities between components. Otherwise, we recommend skipping over this section and focusing on our more in-depth analysis in the following sections.


Photography: Lightroom Classic


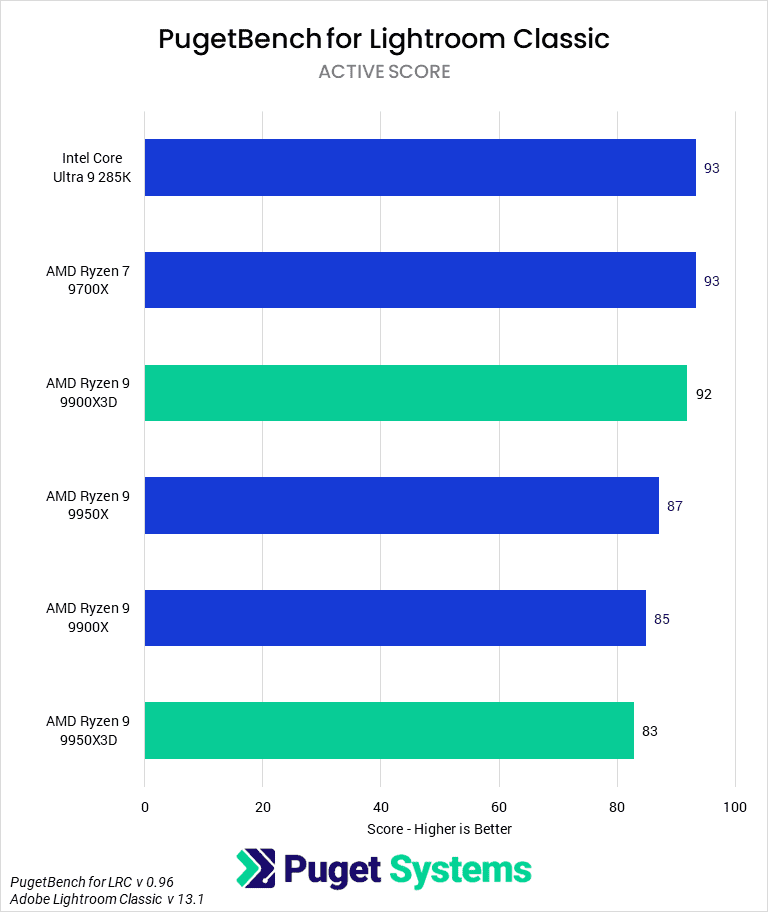

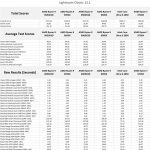
We had some issues with data collection with Lightroom Classic during this round of testing, so unfortunately, we don’t have a full suite of results; we will endeavor to collect updated performance data for the 265K and 9800X3D in the near future. Also, our current Lightroom benchmark tends to have a somewhat higher variance between test runs than most of our other benchmarks. Nonetheless, Lightroom Classic is a common photography application, and when dealing with large amounts of photographs, having a faster CPU can make a big difference in the time required to finish a batch task.
In terms of Overall score (Chart #1), the 9950X3D and 9950X3D are rather unimpressive, with both scoring slightly below their non-3D counterparts. Both are within the margin of error we’d typically use with Lightroom Classic, but it does hearken back to the 7950X3D and its lackluster performance in many content-creation applications.
Digging into the sub scores, things don’t look much better. In Active tests (Chart #2), the 9950X3D is the slowest tested processor, perhaps due to some latency or cross-CCD weirdness. The 9900X3D does manage to outscore the 9900X, though, so we are left unsure as to whether we are seeing a real performance change from the 3D V-Cache, or if these processors are just even higher variance than we would normally expect.
Our Passive tests (Chart #3) are similarly confusing, with the 9950X3D now matching the 9950X but the 9900X3D falling behind the 9900X by 11%. Ultimately, we wouldn’t recommend either of these CPUs for Lightroom Classic as, at best, they offer the same performance as the non-X3D counterparts for more money. And Intel is basically always a better value here.
Graphic Design: Adobe Photoshop


Adobe Photoshop is perhaps the most CPU-sensitive media and entertainment application we test. Very little of it is currently GPU accelerated, and it tends to favour high-frequency, single-core performance. Historically, Photoshop was a strong point for Intel but, after we updated our test suite to bring it more in-line with modern Photoshop workflows, we have seen AMD lead in performance.
In Photoshop, the 9950X3D performs well, slightly outperforming the 9950X, putting it only a touch behind the fastest-tested processor, the 9700X. The 9900X3D also manages to equal the 9900X in performance, making it nearly 9% faster than the 285K. Overall, this is a good showing from AMD, as it manages to match or exceed the performance of the non-X3D parts in a workflow that isn’t particularly cache-sensitive. In the past, this was the primary drawback for the X3D parts, but now, the only reason not to get one over the 9950X or 9900X would be the increased price.
Looking at subscores, in our General tasks (Chart #2), the 9950X3D matches the 9950X, both just slightly behind the Ryzen 7s we tested. Similarly, the 9900X3D is essentially the same as the 9900X. In all cases, AMD beats the tested Intel CPUs. Things are much the same in our Filter tests (Chart #3), except that the two dual-CCD X3D parts top the charts, pulling just ahead of the 9950X, 9900X, and 9700X, though all are essentially the same.
These results, paired with the above Lightroom results, pose an interesting question for photographers. Do you go with Intel or AMD? In general, we don’t think the difference is huge either way. However, definitely examine the tasks you spend the most time waiting on between either application and use that to decide which is more important—and remember that some tasks in Lightroom Classic, like image exporting, may be able to be GPU-accelerated.
Video Editing: Adobe Premiere Pro
In this round of testing with Premiere Pro (and, to a lesser extent, DaVinci Resolve), we found the 9800X3D to perform anomalously poorly compared to previous testing with the part. We are currently investigating why and hope to have corrected charts in the near future. You can find our initial review of the 9800X3D here.


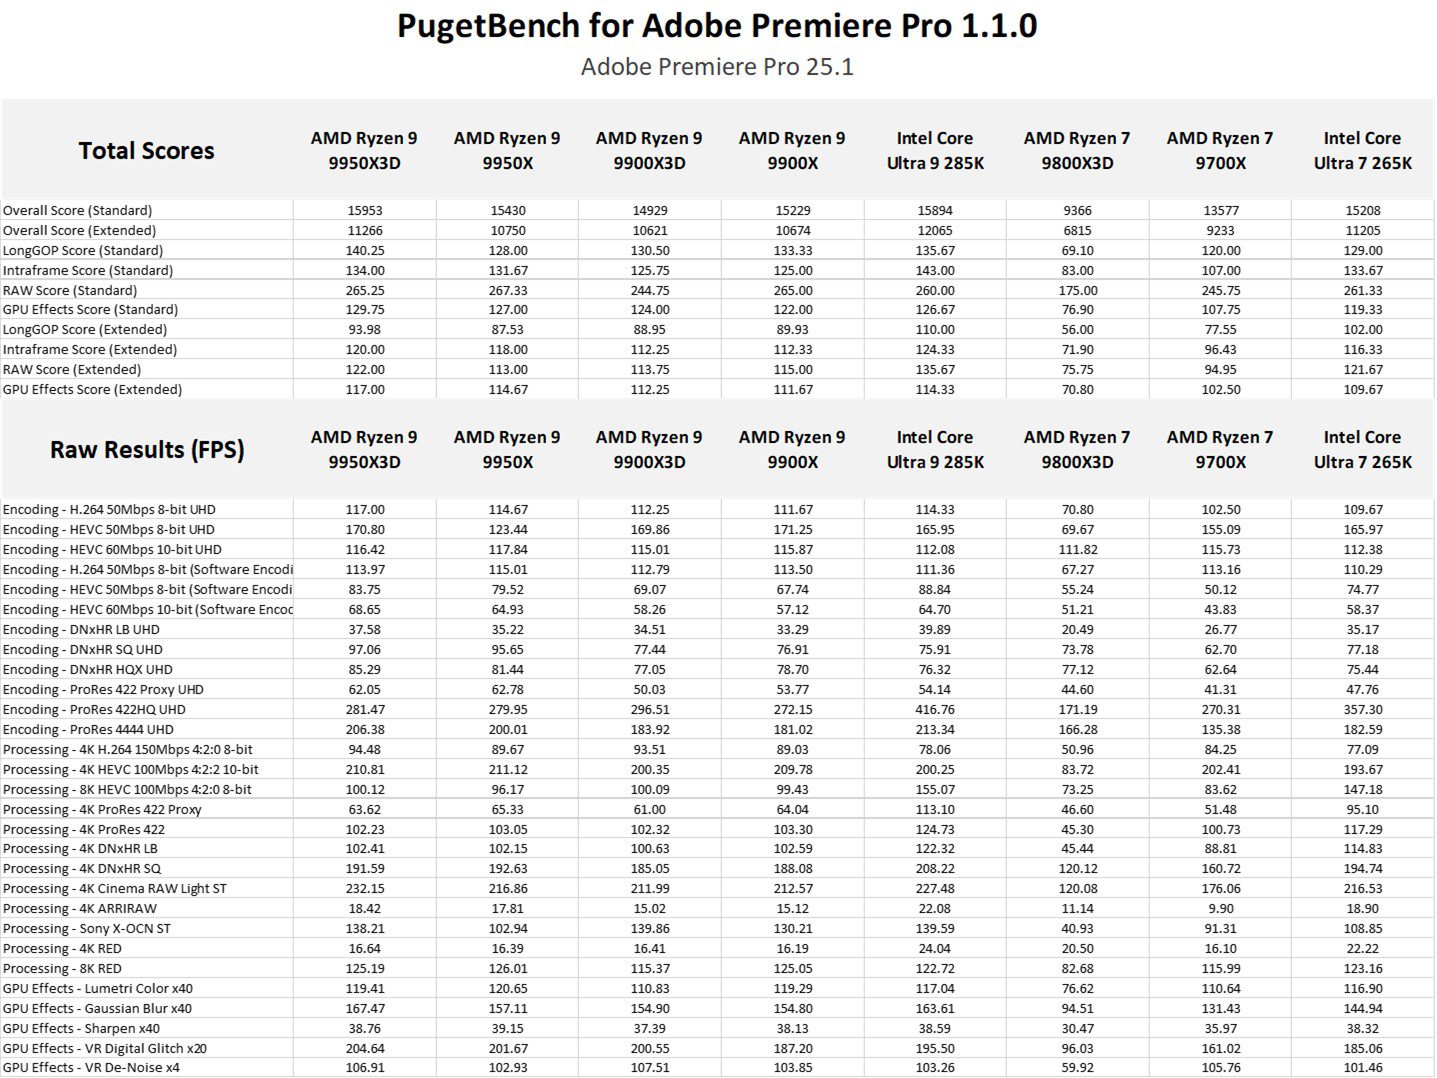
In Premiere Pro, the 9950X3D is the second-fastest processor, behind only the 285K by 7% and 5% ahead of the 9950X. The 9900X3D doesn’t see those overall gains, though, instead only tying the 9900X. However, the Overall score (Chart #1) doesn’t tell the entire story of Premiere Pro and these processors, which has changed somewhat given the recent release of the 50-series NVIDIA GPUs—and their improved media engines.
LongGOP codecs (Chart #2) are traditionally the area where Intel has had the most advantage in video editing applications, as they were the only way to get acceleration for certain “flavors” of H.264/HEVC. NVIDIA Blackwell changes that and also features more competent media engines. Due to this, the current Premiere Pro release (25.1) has defaulted to using NVIDIA for decoding over Intel where supported (H.265 4:2:2 10-bit is not currently supported for Blackwell in Premiere Pro). This means that, although it appears that AMD has “closed the gap” between it and Intel in our LongGOP tests, this is only really true when paired with a 50-series NVIDIA GPU. Readers beware.
Nonetheless, in our LongGOP tests, the 9950X3D outperforms the 9950X by 7%, putting it 9% behind the 265K and 17% behind the 285K. Much like in Overall score, the 9900X3D merely matches the 9900X. You shouldn’t buy an X3D (or AMD) processor if your primary workflow involves LongGOP codecs right now, but it is still good to see AMD inching closer to Intel in this workflow, even if it is with the help of NVIDIA.
Moving on to Intraframe codecs (Chart #3), we have a test suite that is primarily CPU-bound. The performance gains here are smaller, with the 9950X3D within the margin of error of the 9950X and the 9900X3D matching the 9900X. It is disappointing to not see any improvements here but, as we said in our Photoshop section, a lack of regression is progress for AMD. Nearly any of the tested CPUs are totally sufficient for working with Intraframe codecs.
RAW codecs (Chart #4) are fairly heavy on both the GPU and CPU, and they tend to be much heavier to work with than Intraframe. Here, we once again see small performance improvements from the 9950X3D over the 9950X and identical performance between the 9900X3D and 9900X. This is still Intel-favored, but AMD is competent if it’s not your primary workflow.
Our final set of tests in Premiere Pro is GPU Effects (Chart #5). As you would expect, this is principally GPU-bound, and CPU only has an effect on the score as you start getting into the low-end. In this case, all the CPUs perform functionally identically, with the 9700X trailing behind slightly.
Overall, we are satisfied with the performance of the 9950X3D and 9900X3D in Premiere Pro. Although they don’t offer much in the way of additional performance, we found the 9950X3D to be about 7% faster on average than the 9950X. This still makes it slower than the 285K in virtually every subscore and only a bit ahead of the 265K, but if you aren’t working with Premiere Pro as your primary application, that is probably acceptable. What is impressive is that AMD is no longer paying the X3D performance tax in workflows like these.
Motion Graphics: Adobe After Effects


System Image
Moving on to Adobe After Effects, we once again have an application that is primarily CPU-bound. However, since the last time we did a CPU review, we have overhauled our After Effects benchmark; we are now including the new 3D workflows as part of our testing. These workflows are GPU-based, so we wouldn’t expect them to have much impact on the score. There are a few results that are lower than we would expect in our Overall scores due to the 3D tests, though, and the After Effects build that is required for our benchmark to run is still in Beta. Because of this, we have only included the CPU-based parts of our After Effects benchmark: 2D and Tracking.
In our 2D tests (Chart #1), the 9950X3D matches the 9950X and 285K. Our testing does show it as the fastest CPU in these workflows, but by a marginal amount. The 9900X3D trails slightly behind the 9900X, matching the 9800X3D. Overall, most CPUs are totally sufficient for 2D work in After Effects, with only a 14% gap between the 9950X3D and 9800X3D—only the 9700X is truly unimpressive.
Our tracking scores (Chart #2) show little differentiation between the processors, as Tracking is single-threaded, and most modern processors have fairly similar single-threaded performance.
Video Editing / Motion Graphics: DaVinci Resolve Studio


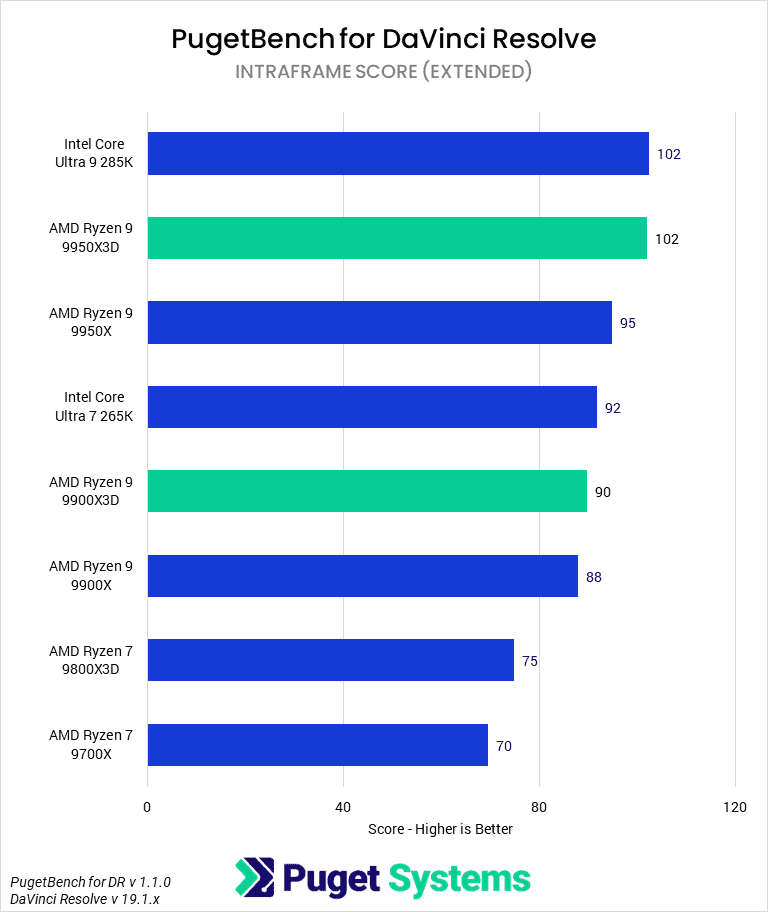


DaVinci Resolve is another application with a broad set of individual workflows that utilize hardware differently across them. Compared to Premiere Pro, it tends to be more reliant on the GPU for acceleration, but there are portions of it that are still CPU-bound. Unlike Premiere Pro, the pre-release build of DaVinci Resolve Studio we are using has full support for the new Blackwell media encoders.
Starting with the Overall score (Chart #1), we see that the 9950X3D is the fastest CPU we tested in DaVinci Resolve, narrowly beating the 285K by a fraction of a percent. It does manage to actually put up a performance advantage over the 9950X of 4%—just within our standard margin of error. The 9900X3D is less impressive, merely matching the 9900X. None of the margins are huge in the overall score, though, so to see a meaningful upgrade, we will have to look at subscores.
Our first subscore is our LongGOP tests (Chart #2), which are a much less useful metric now than in the past. As this version of Resolve supports all the media encoder functionalities of the new NVIDIA cards, we see identical performance across Intel and AMD, as Resolve prefers the Blackwell accelerators. However, if you are not pairing these processors with a 50-series card, Intel will be better than AMD due to their expanded HEVC codec support. We may have to follow up this post with a look at LongGOP performance when not using NVIDIA GeForce RTX 5080s.
After LongGOP codecs are Intraframe codecs (Chart #3) which tend to be lighter and CPU-bound. Here, the 285K and 9950X3D are tied, with a 7% performance lead over the 9950X and 13% over the 9900X3D. The 9900X3D only manages to barely beat out the 9900X, but not in any meaningful way. Overall, any of these CPUs would be totally fine for most Intraframe work, but the 9950X3D is impressive.
RAW codecs (Chart #4) are a mix of CPU and GPU depending on the specific codec. Here, the 9950X3D is slightly ahead of the 9950X and 285K, making it the fastest desktop processor of this class for working with RAW codecs in DaVinci Resolve. The 9900X or 265K may make more sense, though, as those are only slightly behind for much less money.
GPU Effects (Chart #5) and AI (Chart #7) are both largely GPU-bound and so we see little to no differentiation between processors. However, in Fusion (Chart #6), we do see some. Here, the 285K is still on the top of the pack, followed by the 9800X3D, but it is only 4% faster than the 9950X3D, rather than the 9% over the 9950X. Nothing groundbreaking here, but Fusion is a test suite where we saw a lot of performance regression with the 7950X3D, so it is good to see AMD has resolved those issues with this generation.
Overall, we wouldn’t recommend spending the extra money on a 9950X3D purely for DaVinci Resolve work, but you aren’t sacrificing much if you decide to go with it. The only thing to watch out for is that the lower-end parts may offer better value, and depending on your GPU, the 285K may still be necessary for working with LongGOP codecs.
Game Dev / Virtual Production: Unreal Engine


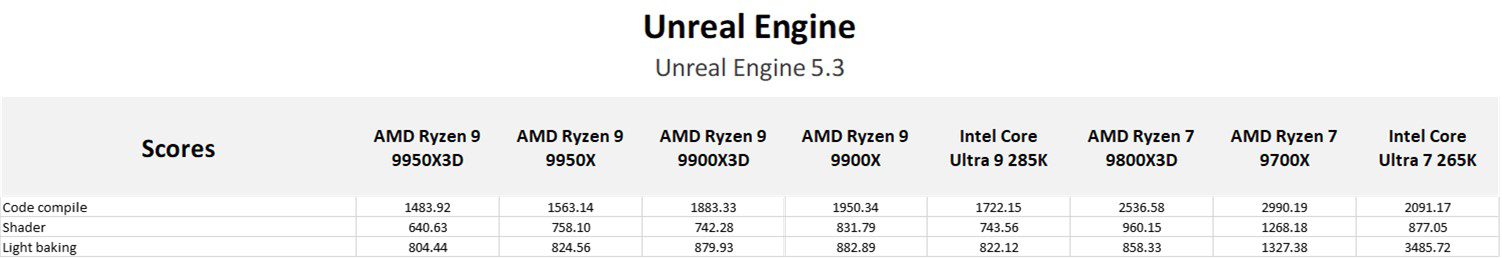
Moving on to our game development benchmarks, we have a variety of tasks related to Unreal Engine. First is compiling the engine itself, which can act as a proxy for other coding workflows, followed by shader compilation and building lighting. The latter two aren’t always the most common CPU-based task for game developers, but can be relevant to certain workflows.
Starting with Code Compilation time (Chart #1), we see the 9950X3D put up a solid lead over the 9950X, completing the benchmark in 95% of the time. The 9900X3D is similar, finishing in 96% of the time of the 9900X. This isn’t a revolutionary speedup of these tasks, but the 3D V-Cache definitely helps to complete code compilation tasks more quickly.
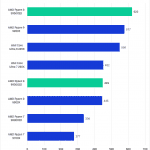
Moving on to Shader Compilation (Chart #2), we see the new X3D processors make large gains over every other processor. The 9950X3D finishes in just 641 seconds, compared to the 9950X’s 758 seconds, an 18% speedup. The 9900X3D manages to just beat the 285K, with a time of 742 seconds compared to the Intel’s 744 or the 9900X’s 832 seconds. The high L3 cache is designed for exactly this sort of workflow.
Finally, we see basically no performance improvements when it comes to Light Baking (Chart #3). Of note, we did remove the 265K from the chart as it did not complete the benchmark properly, but in general, the 9950X3D performs the same as a 285K and 9950X, while the 9900X3D is just a 9900X. Again, not losing performance with X3D processors is a good improvement from last gen, but you aren’t gaining anything in this workload.
Overall, the X3D processors seem tailor-made for game dev. Other review sites have already shown their phenomenal gaming performance, and they also serve to speed up some potentially important portions of a game devs workflow.
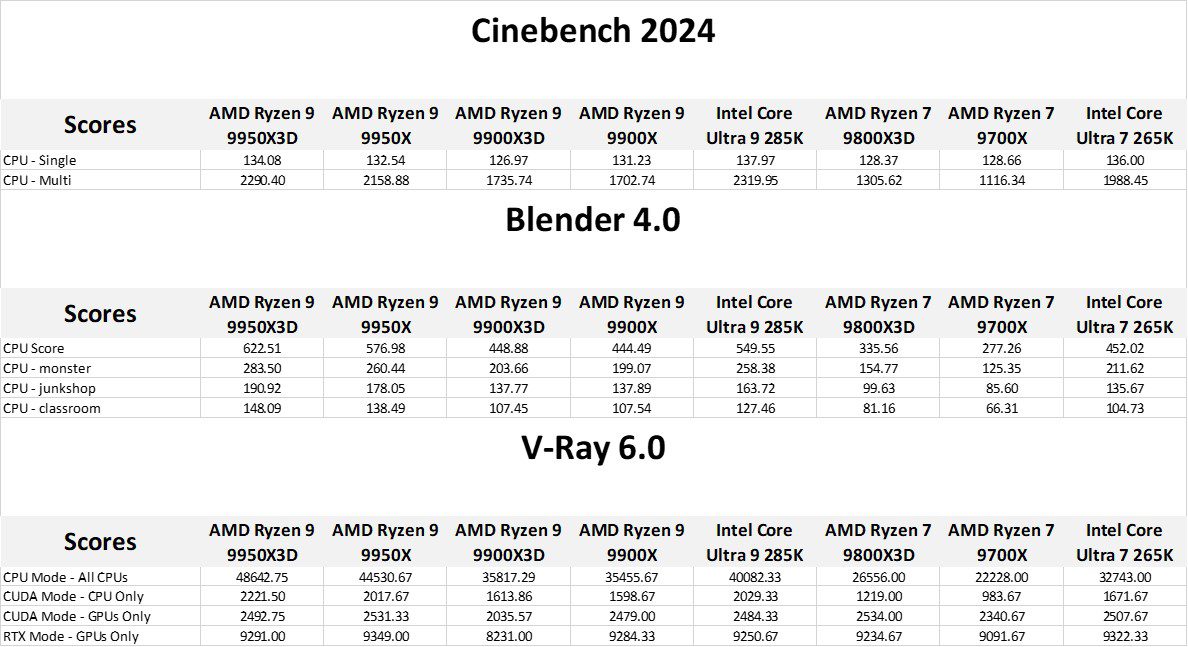
CPU Rendering: Cinebench, Blender, & V-Ray


Our final set of benchmarks are offline renderers. Typically, we wouldn’t recommend doing CPU rendering on a desktop processor for professional use; a HEDT / workstation processor like Threadripper 7000 will offer much better performance and higher RAM capacities, while the GPU in the system will likely offer much higher performance, albeit at lower VRAM capacities. Nonetheless, these rendering benchmarks are useful to some artists and can act as a good proxy for some other workflows.
Starting with Cinebench Single-core, a synthetic benchmark, the 9950X3D and 9950X are basically identical. Neither give the best single-core performance, but they are close enough to the Intel Core Ultra processors. The 9900X3D does lag a bit behind in our testing here but, again, the difference is a few percent at most.
Cinebench Multicore (Chart #2) is closer to a real-world benchmark, in that it uses the Redshift engine, such as is used in unpaid Cinema 4D integrations. We still have Intel as the performance leader here by a hair, but the 9950X3D closes the gap between the 285K and 9950X, leading the latter by 6%. The 9900X3D, meanwhile, is within the margin of error of the 9900X. Cinebench isn’t an application that can highlight the additional L3 cache, so we weren’t expecting a performance increase to speak of. However, it is an application that was sensitive to the lower frequencies of previous-generation X3D parts, which we don’t see here.
Blender is another rendering engine that offers CPU-based rendering. Most of our recent testing has shown is somewhat favoring AMD, especially in the HEDT space where the Threadripper PRO 7995WX is unmatched. In this round of testing, we found that the 9950X3D was 8% faster than our 9950X and 13% faster than the 285K. The 9900X3D instead merely matches the 9900X and 265K. Ultimately, the 9950X and X3D are good values in this workflow, but the 265K may be a better overall choice than the 9900X/X3D.
The final offline renderer we test with at present is Chaos’ V-Ray (Chart #4). Here, then, 9950X3D has a 9% lead over the 9950X, extending the advantage over Intel’s 285K to a large 21%. The 9900X3D is less impressive, merely matching the 9900X. Both of these CPUs are great for V-Ray CPU rendering, but only the 9950X3D really distinguishes itself as being worth the additional money.
How good are the AMD Ryzen 9950X3D and 9900X3D for Content Creation?
Overall, the AMD Ryzen 9 9950X3D and 9900X3D are impressive CPUs that perform admirably across a wide variety of workflows. One of the primary concerns, only partially alleviated after seeing the performance of the 9800X3D last year, was that the 3D V-Cache parts would once again be a compromise both in terms of professional and gaming performance. Offering not the best in either category, but an unfortunate middle-ground where you are asked to pay more for worse performance in both arenas. A true jack-of-all-trades, master-of-none situation.
Fortunately, AMD has overcome this hurdle and released a processor in the Ryzen 9950X3D (and, to a lesser extent, the 9900X3D), which can rightly be called the fastest processor for both professional content creation and gaming. Although it likely isn’t worth the upgrade if you are currently on a Ryzen 9000 processor, the 9950X3D and 9900X3D make compelling upgrades from last-gen processors of either “team” and are especially desirable if you want to work and game on the same system. Otherwise, they offer performance improvements in some specific use cases like compiling code or shaders, some rendering applications, and certain other latency-sensitive workflows.
We can summarize most of our findings relatively easily. In our testing, the 9950X3D was, on average, 7% faster than the 9950X. Exceptions to this were in Lightroom Classic, where we saw some minimal performance regression, and Unreal Engine, where our Shader Compilation test had it 18% faster. Similarly, the 9900X3D was on par with the 9900X, save for the slight performance hit in Lightroom Classic and the 12% speed up in Shader Compilation.
While we can’t quite recommend the 9950X3D or 9900X3D for every workflow, the processors are definitely poised to be the best generalist CPUs on the market and offer compelling performance in every application we tested. Some reasons you may not go with them include needing the Quick Sync functionality from Intel processors (especially if you lack a GeForce 50-series NVIDIA card), having heavy Lightroom or Redshift CPU usage, or don’t find the additional gaming performance worth the price increase over the 9950X and 9900X. Otherwise, the AMD Ryzen 9950X3D and 9900X3D are terrific options, and worth strong consideration for a content creation workstation.
If you need a powerful workstation to tackle the applications we’ve tested, the Puget Systems workstations on our solutions page are tailored to excel in various software packages. If you prefer to take a more hands-on approach, our custom configuration page helps you to configure a workstation that matches your exact needs. Otherwise, if you would like more guidance in configuring a workstation that aligns with your unique workflow, our knowledgeable technology consultants are here to lend their expertise.
Looking for a content creation workstation?
We build computers tailor-made for your workflow.
Don’t know where to start?
We can help!
Get in touch with one of our technical consultants today.